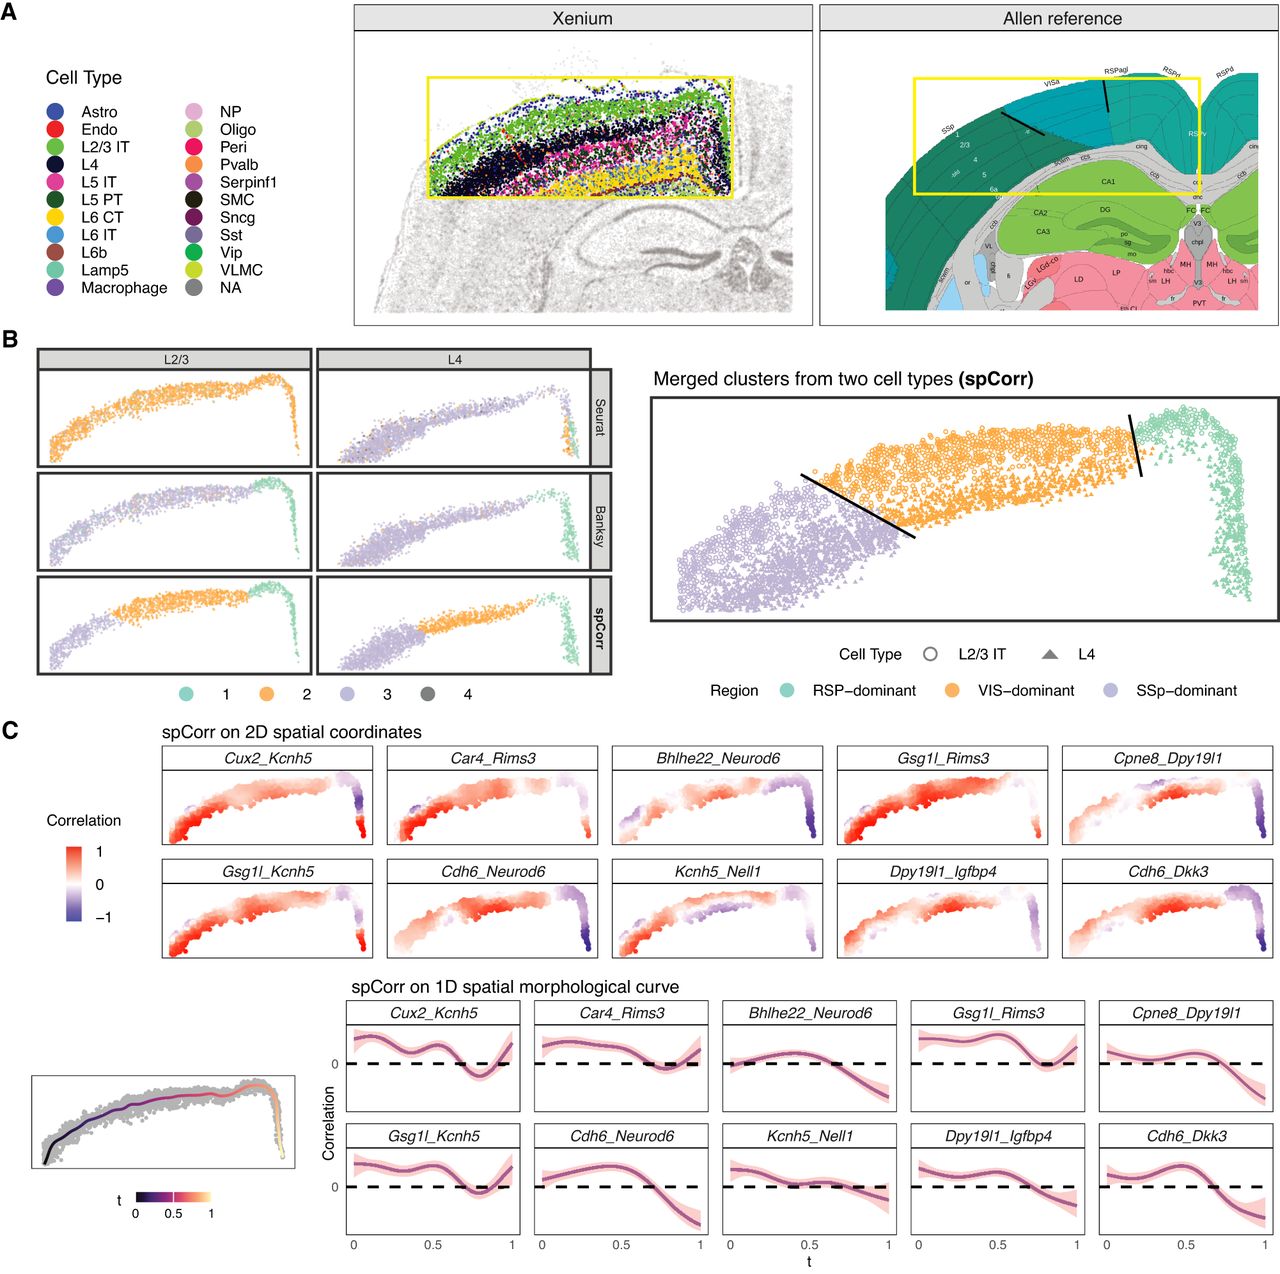
spCorr reveals functional regions within mouse brain cortex layers. (A) Visualization of mouse brain structure. Left: cell type annotation on a Xenium data set. The yellow box shows the cortex region of interest with clear layer structures. Right: reference structure from Allen Brain Atlas. The yellow box is located approximately in the same place as the one on the left. Solid black lines divide adjacent functional regions across layers. (B) Comparison of clustering based on gene expression and spatially varying correlation (SVC). Left: clustering results by Seurat and BANKSY on gene expression and on spCorr-inferred local correlation estimates. Although Seurat and BANKSY clusters on gene expression do not show clear patterns, clusters on SVC exhibit three spatially well-separated clusters. Right: alignment of spCorr-inferred clusters between two adjacent cell type layers. The three clusters in each cell type are well aligned across layers, and roughly match the three functional domains in the Allen Brain Atlas. (C) Visualization of spCorr-inferred local correlation estimates. Top: local correlation estimates of the top ten SVC gene pairs in the original two-dimensional space. Bottom: local correlation estimates of the same gene pairs in the one-dimensional spatial curve space. The shadow labels the 95% confidence interval.