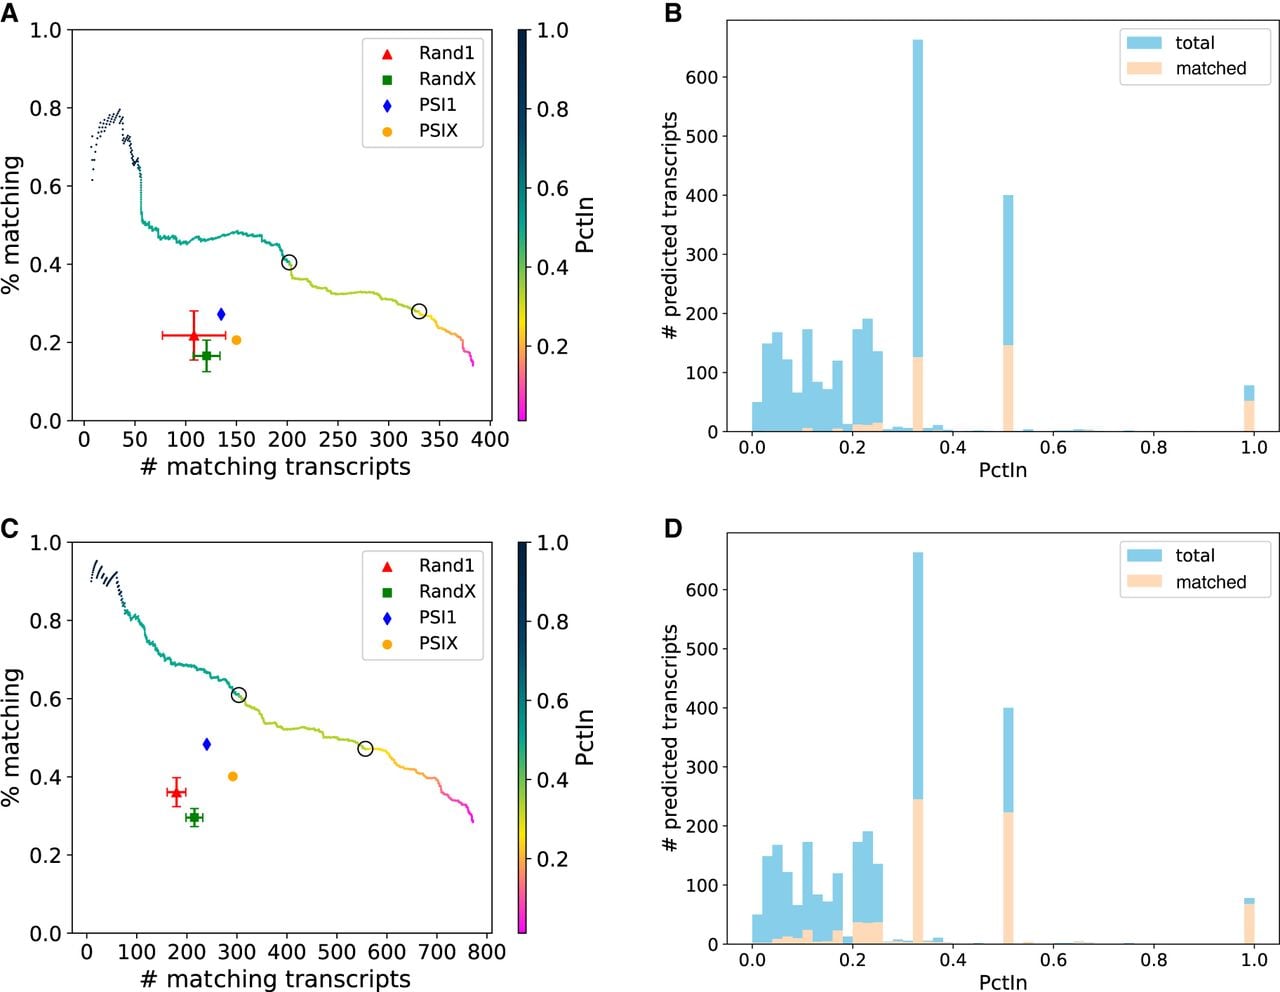
TENNIS outperforms baseline methods in transcript-retrieval simulations. (A) The number and percentage of transcript predictions validated against exactly removed isoforms. The color gradient indicates PctIn values, with circles highlighting critical thresholds (PctIn = 0.5, 0.333). Baseline methods include random (Rand1, RandX) and PSI-based (PSI1, PSIX) approaches. Error bars represent standard deviation over 5 repetitions. (B) Histogram of PctIn values for predicted transcripts validated against exactly removed isoforms. (C) The number and percentage of transcript predictions validated against combined ground truth (exactly removed isoforms + long-read RNA-seq assembly), using the same color scheme as panel A. (D) Histogram of PctIn values for predicted transcripts validated against the combined ground truth.