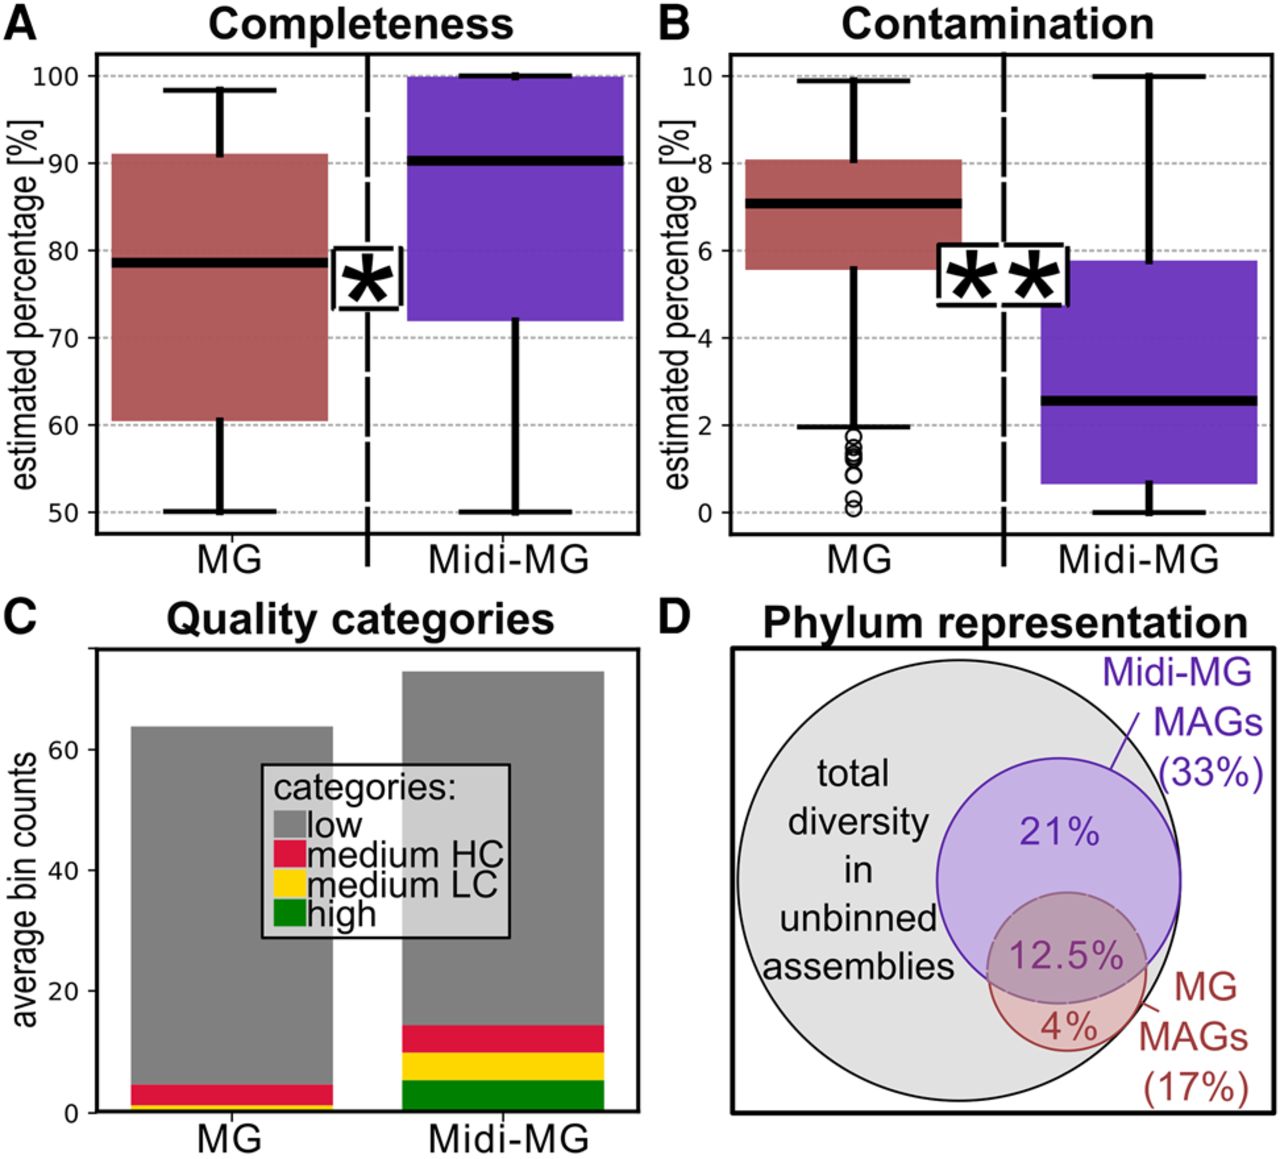
Comparison of quality metrics and diversity of MAGs obtained from standard metagenomic and midi-metagenomic coassemblies. (A,B) Boxplots showing the distribution of CheckM2 completeness and contamination estimates, respectively. The difference between metagenomic and midi-metagenomic results was found to be statistically significant (P < 0.01 based on the Moods median test) (Gibbons 2005) in both cases. A more detailed plot showing individual results is given in Supplemental Figure S5. (C) Average number of MAGs belonging to different quality categories obtained by standard metagenomics and midi-metagenomics. (D) Relative fractions of total phylum level diversity detected in the unbinned metagenomic coassemblies that are represented by metagenomic and midi-metagenomic MAGs, respectively. (MG) Metagenome, (Midi-MG) midi-metagenome.