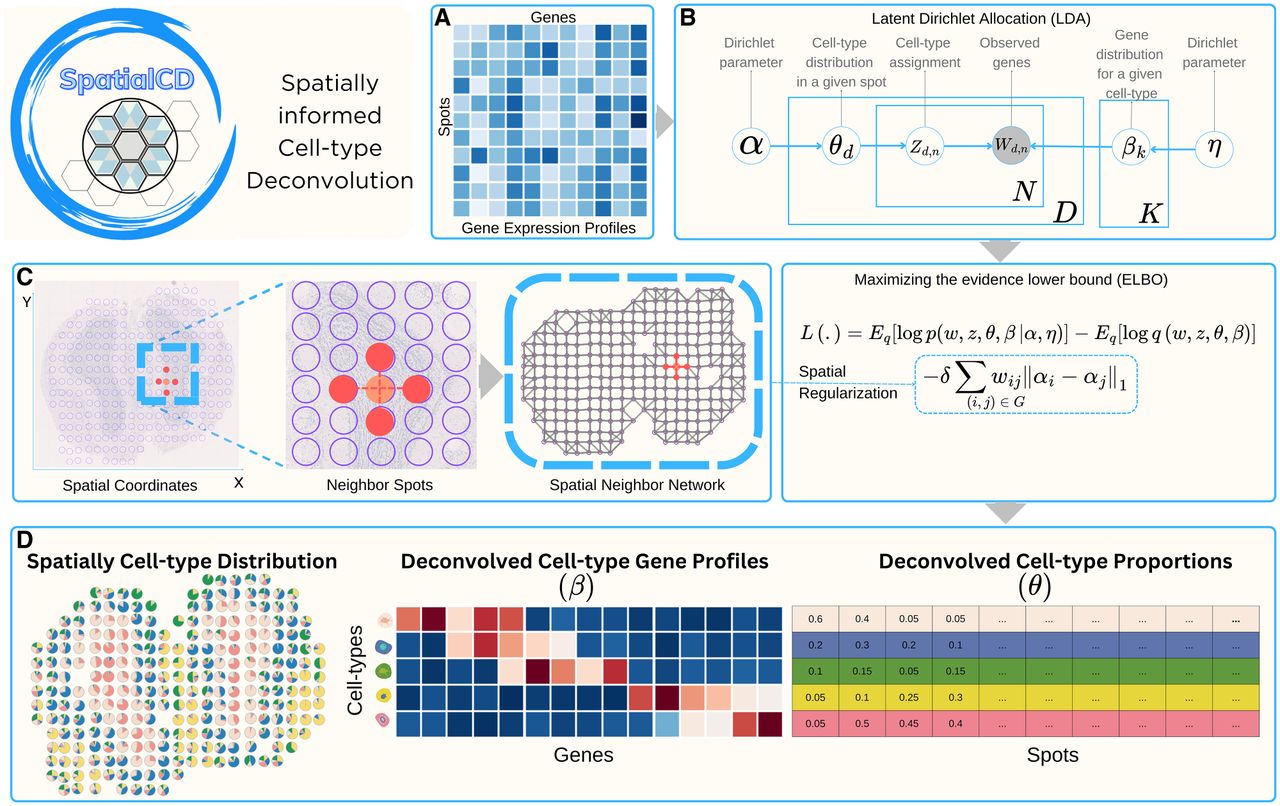
Overview of SpatialCD. (A) SpatialCD takes as input spatial transcriptomics data represented by a gene expression matrix (spot-by-gene matrix) and the corresponding spatial coordinates of spots (spot-by-2 matrix). (B) Graphical model of SpatialCD based on Latent Dirichlet Allocation (LDA), in which shaded nodes denote observed variables and unshaded nodes denote latent variables. (C) SpatialCD constructs a spatial nearest-neighbor graph and incorporates it into the LDA framework through spatial regularization terms. (D) SpatialCD simultaneously infers cell-type composition (θ, spot-by-cell-type matrix) and transcriptional profiles (β, cell-type-by-gene matrix). The proportions of deconvolved cell-types can be spatially visualized across the spots.