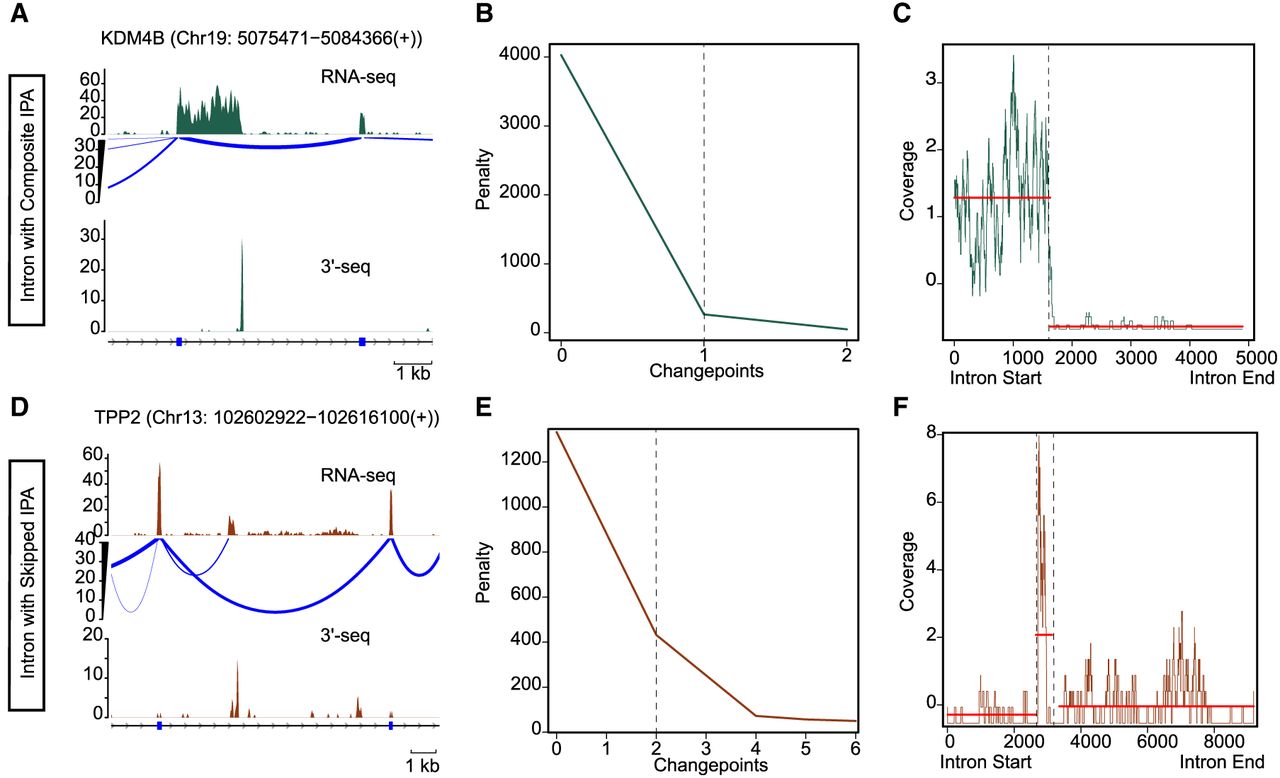
Changepoint detection of IPA sites by PELT. (A, top) Bulk RNA-seq coverage (raw read count of uniquely mapping reads) over a genomic locus annotated as intron by RefSeq. The sashimi plot shows the splicing complexity at the locus. (Bottom) Peaks (raw read count of mapped reads at the locus) detected by 3′-seq, a high-throughput 3′-end detection and quantification approach. This is a representation of a composite IPA event. The gene locus presented here is located on the sense strand of DNA. (B) Elbow plot demonstrates the number of changepoints (x-axis) detected by PELT over a range of penalties (y-axis) over the locus shown in A. This plot shows detection of one changepoint generated owing to 3′-end formation. (C) Plot shows the read coverage over the intron in A. It highlights the two segments detected by PELT with the maximum difference in mean of the segments. (D) As in A but shows the locus of a skipped IPA event. The gene locus presented here is located on the sense strand of DNA. (E) As in B but shows detection of two changepoints for the locus shown in D. One changepoint explains the splicing, and the second changepoint highlights the 3′-end formation. (F) As in C but for the locus shown in D. PELT detects three segments with different means using the read coverage over the intron shown in D.