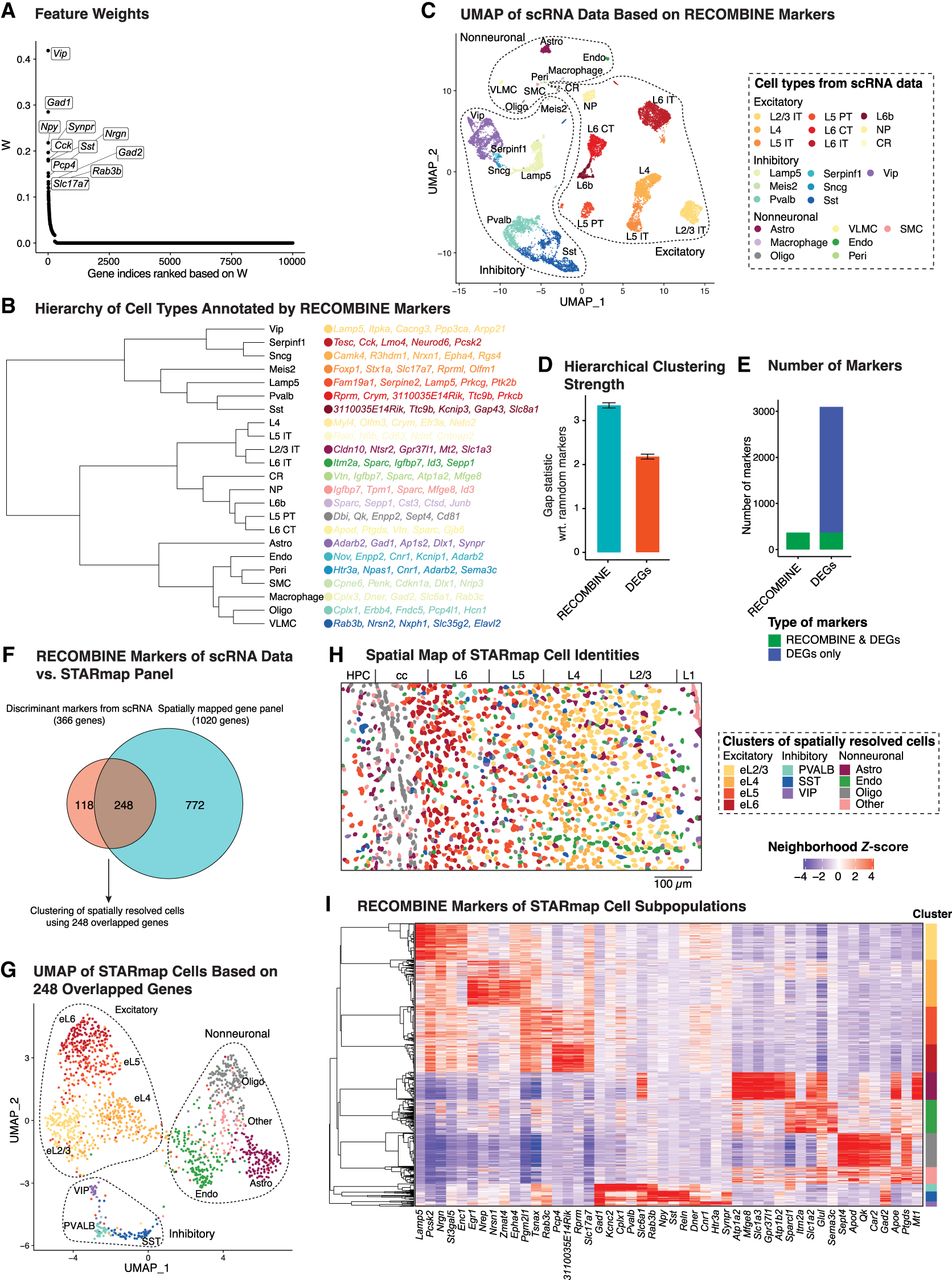
RECOMBINE selects composite markers that define hierarchical cell types and provides an optimized panel for spatial profiling of mouse visual cortex. (A) Feature weights of all genes in which the top 10 discriminant markers are labeled. (B) Hierarchy of cell types annotated by top five RECOMBINE markers. (C) UMAP of cells based on RECOMBINE markers, in which colors indicate cell-type labels from Tasic et al. (2018). Cell-type abbreviations: (IT) intratelencephalic, (PT) pyramidal tract, (CT) corticothalamic, (NP) near-projecting, (CR) Cajal–Retzius cell, (Astro) astrocyte, (Oligo) oligodendrocyte, (VLMC) vascular leptomeningeal cell, (Endo) endothelial cell, (Peri) pericyte, and (SMC) smooth muscle cell. (D) Comparison of hierarchical clustering performance between RECOMBINE markers and top DEGs of the same size. (E) Comparison of RECOMBINE markers and DEGs. DEGs were obtained by Wilcoxon tests of each cell type with respect to the rest of cell types and filtered based on an absolute log2 fold-change >0.25 and false-discovery rate <0.05. (F) Venn diagram of discriminant markers in the scRNA data and the genes profiled in the spatial data. (G) UMAP of spatially resolved cells based on RECOMBINE markers (N = 248) and colored by clusters. (H) Spatial map of cells with the same color code of cell clusters in E. (I) Heatmap of neighborhood Z-scores showing gene modules across cell clusters of the spatial data. For each cluster, the gene module includes the top five genes with mean neighborhood Z-score > 2, ranked by decreasing fraction of significant cells. (L1–L6) The six neocortical layers, (cc) corpus callosum, and (HPC) hippocampus.