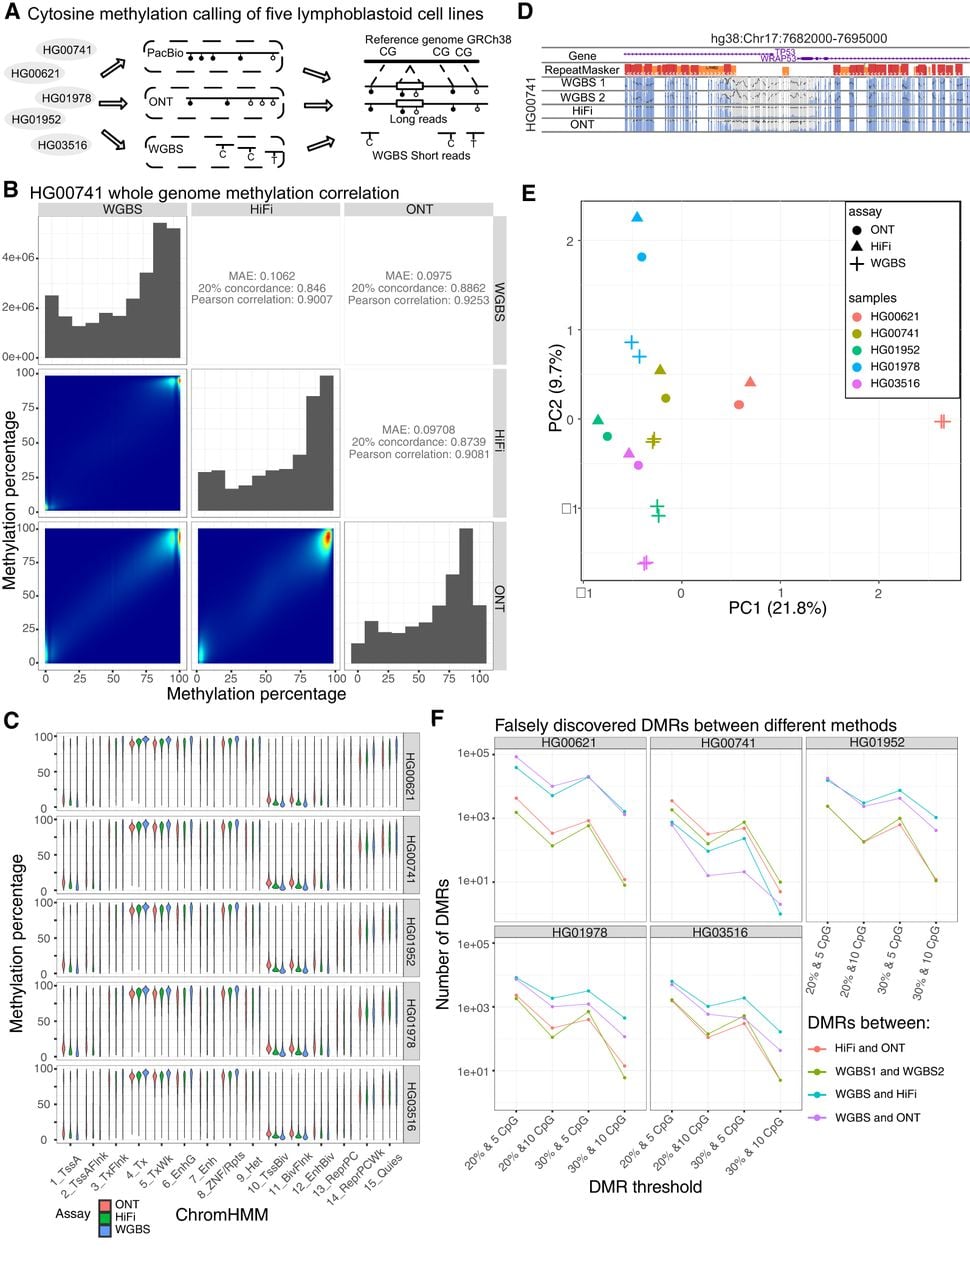
Comparing CpG methylation calling accuracy between PacBio, ONT, and WGBS. (A) Study design of methylation calling benchmarking. We performed CpG methylation calling for five HPRC samples (HG00621, HG00741, HG01952, HG01978, and HG03516), using PacBio, ONT, and WGBS. We mapped all reads to the human reference genome GRCh38 to compare their differences. (B) Whole-genome methylation percentage correlation between WGBS, HiFi, and ONT methylation of HG00741. The whole-genome methylation percentage distribution is represented as a density plot. The correlation heatmap and metrics (mean average error, 20% concordance, and Pearson's correlation) are plotted on the bottom left and top right, respectively. (C) Methylation percentage distribution of the GM12878 15 ChromHMM states across all five samples. The 15 ChromHMM states are listed on the x-axis, and methylation calling results from different methods are colored differently. (D) WashU Epigenome Browser screenshot of the two WGBS replicates, HiFi, and ONT methylation of HG00741 on the 10 kb window around the TP53 gene promoter. All methylC tracks y-axis percentage was from 0% to 100%. (E) PCA plot of the top two principal components of the whole-genome methylation from the five HPRC samples. For each sample, we performed two replicates of WGBS in addition to HiFi and ONT methylation calling. We used different shapes to represent different methods (circle, triangle, and cross for ONT, HiFi, and WGBS, respectively) and different colors to represent different samples (red, yellow, green, blue, and purple for HG00621, HG00741, HG01952, HG01978, and HG03516, respectively). (F) Number of falsely discovered differentially methylated regions (DMRs) using different threshold cutoffs. Four different thresholds (20% average methylation difference with at least five CpG sites, 20% average methylation difference with at least 10 CpG sites, 30% average methylation difference with at least five CpG sites, and 30% average methylation difference with at least 10 CpG sites) are represented on the x-axis. The number of DMRs are represented on the y-axis. The number of DMRs between different methods under different conditions are plotted using different colors.