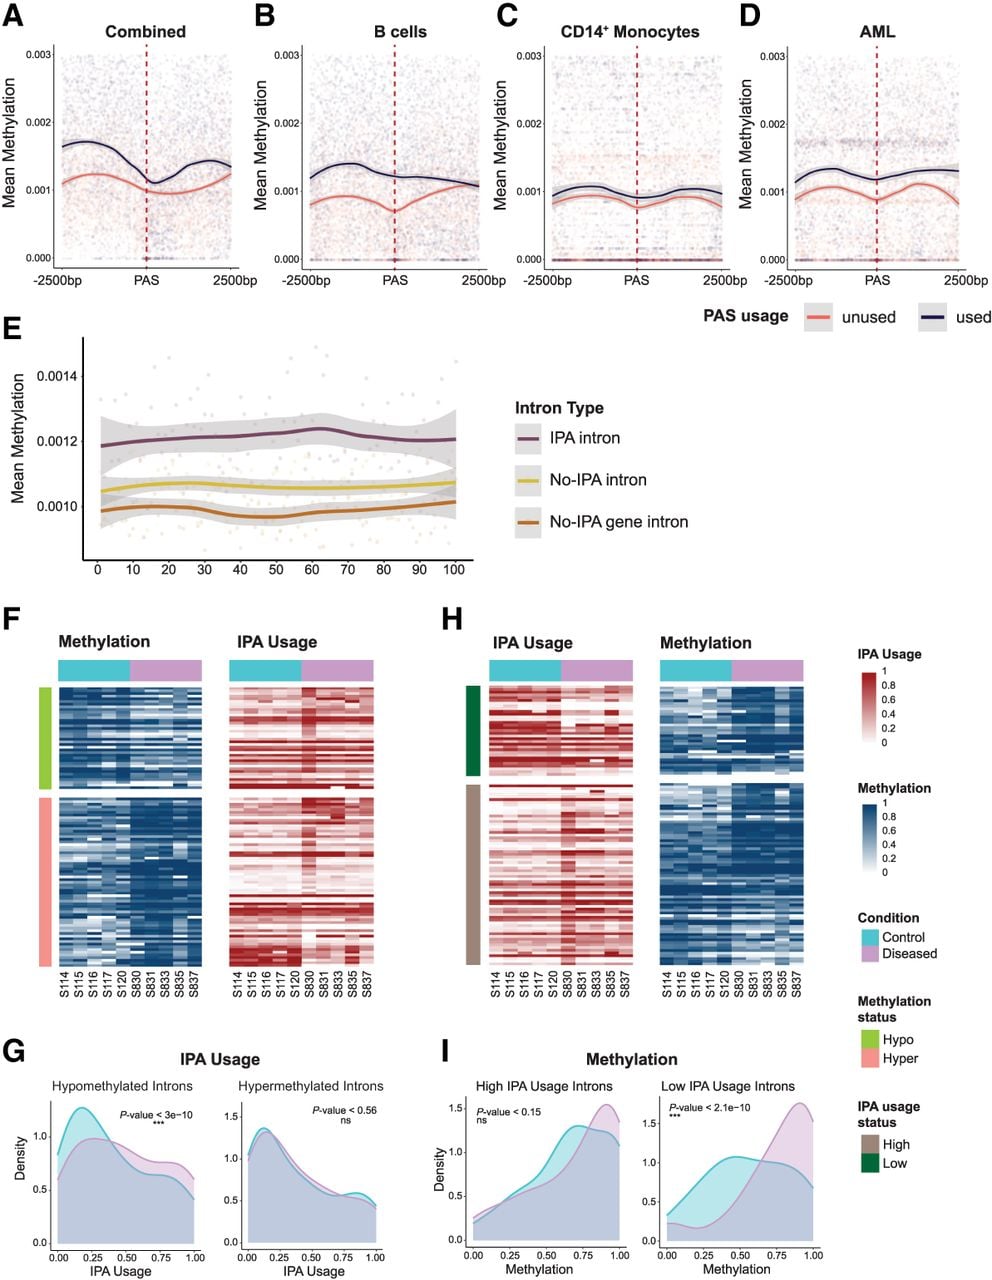
Epigenetic regulation of IPA in immune cells. (A) Integrated methylation analysis at IPA sites. Metagene analysis of DNA methylation patterns within ±2500 bp of PAS revealed distinct epigenetic landscapes between used (orange) and unused (navy) PAS loci. Used PAS sites exhibited significantly higher methylation levels across all samples compared with unused PAS (Kolmogorov–Smirnov test, P-value ≤ 9.88 × 10−270), with mean methylation differences persisting across the entire genomic window. This analysis encompassed 910 used PAS sites, 1820 unused PAS sites, and about 5.7 million genomic methylation sites. (B) The cell-type-specific methylation state around IPA sites in B cells. Metagene analysis of DNA methylation within ±2500 bp of PAS in B cells revealed distinct epigenetic profiles between used (orange) and unused (navy) PAS loci. Used PAS sites exhibited higher methylation levels compared with unused PAS sites across the entire genomic window (Kolmogorov–Smirnov test, P-value ≤ 5.14 × 10−177). This analysis included 679 used PAS sites, 1358 unused PAS sites, and about 3.4 million methylation sites. (C) Cell-type-specific methylation patterns at IPA sites in CD14+ cells. Metagene analysis of DNA methylation within ±2500 bp of PAS in CD14+ cells revealed that used PAS sites (orange) are consistently flanked by higher methylation levels compared with unused PAS sites (navy; Kolmogorov–Smirnov test, P-value ≤ 3.94 × 10−244). This analysis included 325 used PAS sites, 650 unused PAS sites, and ∼2.95 million methylation sites. (D) DNA methylation landscapes at IPA sites in AML. Metagene analysis of DNA methylation within ±2500 bp of PAS sites in AML demonstrates that used PAS sites (orange) are consistently associated with higher levels of DNA methylation compared with unused PAS sites (navy; Kolmogorov–Smirnov test, P-value < 10−244). This analysis encompassed 552 used PAS sites, 1104 unused PAS sites, and about 2.4 million methylation sites. (E) Rolling window analysis of DNA methylation in IPA and non-IPA introns. Mean DNA methylation levels (y-axis) were calculated for IPA introns (violet), non-IPA introns within IPA genes (yellow), and introns from genes without IPA events (brown) using a sliding window of 100 bp along the intron length (x-axis) with a 50 bp step size. This analysis included 696 IPA introns, 1758 non-IPA introns from IPA genes, and 1303 introns from non-IPA genes, encompassing about 5.7 million methylation sites in total. IPA introns consistently showed significantly higher methylation levels across their entire length compared with both non-IPA introns and introns from non-IPA genes (Kolmogorov–Smirnov test, P-value ≤ 2 × 10⁻¹⁶ for both comparisons). (F) Heatmap of IPA site usage and mean methylation in the introns with differentially methylated sites (GSE184314). The left heatmap shows the mean methylation in the introns coming from differentially methylated sites, and the right heatmap shows the IPA site usage in the corresponding introns. Each row represents a unique intron (n = 101), and columns correspond to individual patient samples (n = 10). Rows are color-coded to indicate the differential methylation status in the introns: hypermethylation (green; n = 38) and hypomethylation (orange; n = 63). Columns are color-coded to indicate the sample groups: control (blue; n = 5) and diseased (pink; n = 5). Methylation is quantified on a zero-to-one scale (blue) with the color intensity reflecting the degree of methylation, and IPA site usage is quantified on a zero-to-one scale (red) relative to full-length isoform usage, with the color intensity reflecting the degree of IPA site usage. (G) Density plot of IPA site usage in introns with differentially methylated sites. Density plots compare IPA site usage in introns harboring differentially methylated sites, separated into hypomethylated (left) and hypermethylated (right) groups as identified in F. In the hypomethylated group (n = 380), IPA site usage differs significantly between the control (blue) and diseased (pink) samples (Wilcoxon paired test, P-value ≤ 3 × 10 −10), whereas in the hypermethylated group (n = 630), no significant difference is observed (Wilcoxon paired test, P-value < 0.56). (H) Heatmap of IPA site usage and mean methylation in the introns with differentially used IPA sites (GSE184314). The left heatmap shows the IPA site usage in the introns coming from differentially used IPA sites, and the right heatmap shows the methylation in the corresponding introns. Each row represents a unique intron (n = 102), and columns correspond to individual patient samples (n = 10). Rows are color-coded to indicate the differential IPA site usage status in the introns: highly used (dark green; n = 36) and lowly used (brown; n = 66). Columns are color-coded to indicate the sample groups: control (blue; n = 5) and diseased (pink; n = 5). Methylation is quantified on a zero-to-one scale (blue) with the color intensity reflecting the degree of methylation, and IPA site usage is quantified on a zero-to-one scale (red) relative to full-length isoform usage, with the color intensity reflecting the degree of IPA site usage. (I) Density plot of methylation levels in introns with differentially used IPA sites. Density plots illustrate methylation levels in introns containing differentially used IPA sites, divided into highly used (left) and lowly used (right) groups as defined in H. For highly used IPA sites (n = 660), a modest but significant difference in methylation is observed between the control (blue) and diseased (pink) samples (Wilcoxon paired test, P-value < 0.15). In contrast, lowly used IPA sites (n = 360) show a pronounced and highly significant methylation difference between the groups (Wilcoxon paired test, P-value ≤ 2.1 × 10⁻¹⁰).