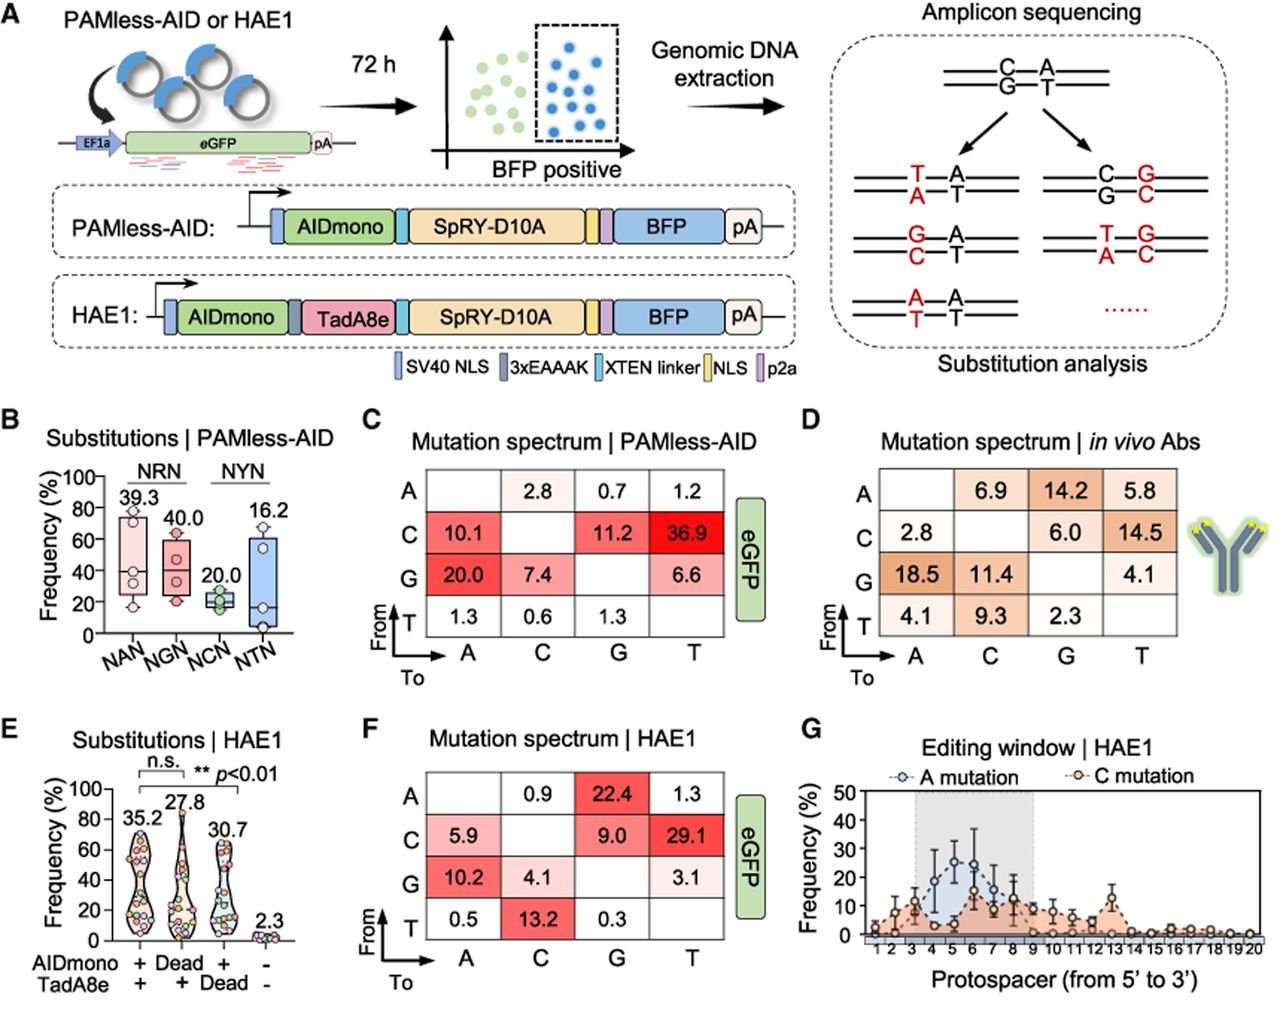
Development of the hyper-antibody editor. (A) Schematics for the assessment of editing efficiency for PAMless-AID and HAE1. 293T-eGFP cells were cotransfected with various sgRNAs and either PAMless-AID or HAE1. BFP-positive cells were sorted 72 h posttransfection for genomic DNA extraction and amplicon sequencing. Editing efficiency and mutation spectrums were analyzed by CRISPResso2. (B) Substitution frequencies of PAMless-AID at 18 sites with NNN-PAM targeting eGFP. Numbers above each bar represent the median substitution percentage. Whiskers extend from the minimum to the maximum values, and box borders represent the first and third quartiles. For NAN and NTN, n = 5; for NCN and NGN, n = 4. (C) The mutation spectrum generated by PAMless-AID at 18 sites targeting eGFP. The entire sequence covered by sgRNAs (20 bp) is calculated for each type of base substitution (each type of substitution divided by total substitutions of four nucleotides occurring within the 20-bp region). The heat map shows the average value of each substitution type of 18 sites. (D) The mutation spectrum generated by AID in human B cells. (E) Substitution efficiencies of HAE1 with different deaminase mutations across 18 sites targeting eGFP. Statistical analysis was performed using a paired two-tailed t-test, with P values indicated or noted as not significant (n.s.) if P > 0.05. (F) The mutation spectrum generated by HAE1 at 18 sites targeting eGFP. (G) Editing window of HAE1. The y-axis indicates the substitution frequencies of C and A at each nucleotide across 18 sites targeting eGFP (n ≥ 3 at each nucleotide). Data are presented as mean ± SEM.