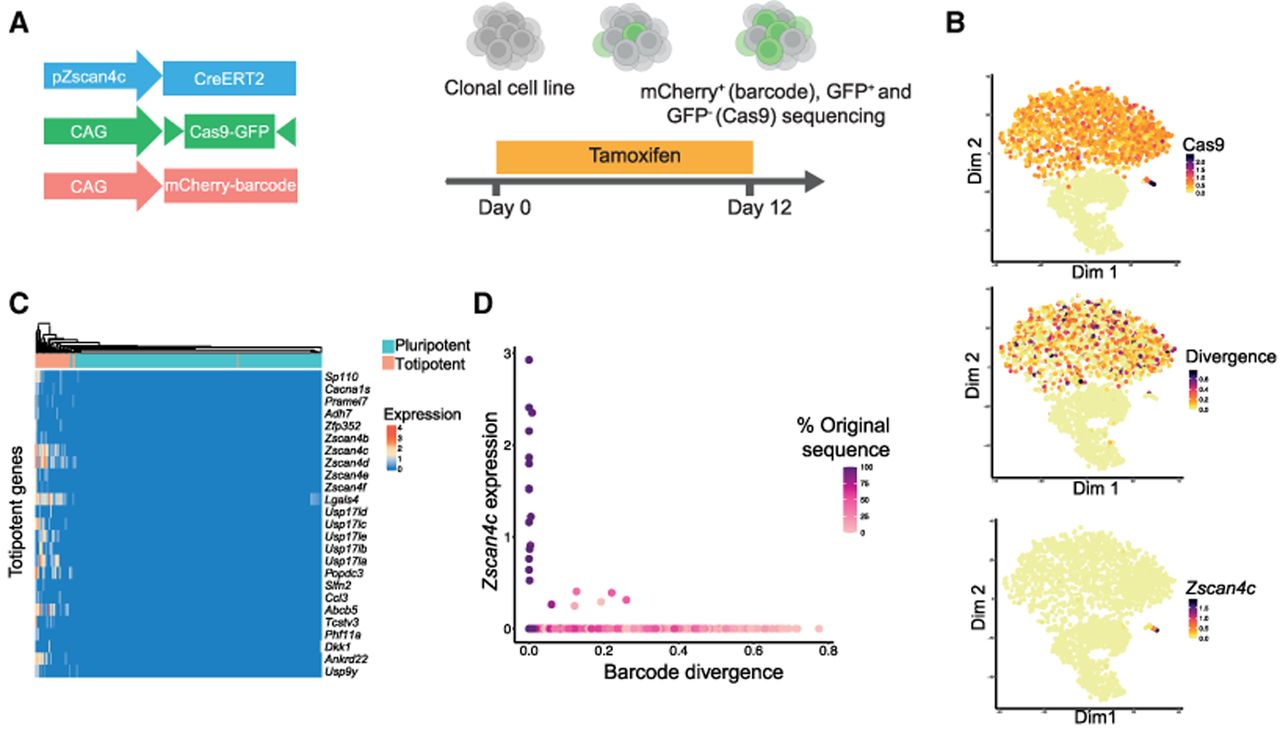
Single-cell recording of 2C-like transitions with scDynaBar. (A) Schematic representation of the experimental setup for tracking 2C-like state transitions. Double-positive cells (∼73%) and a subset of GFP-negative cells (∼27%) were collected for sequencing into a single 10x Genomics run at day 12. (B) t-SNE plot colored by Cas9 expression (top), mean barcode divergence from the original barcode sequence per cell (middle), and Zscan4c expression (log2 normalized counts; bottom). (C) Heatmap displaying gene expression (log2 normalized) for top markers for the totipotent cluster. (D) Scatter plot displaying Zscan4c expression (log2 normalized; y-axis) against barcode divergence (x-axis) per cell, with color indicating the percentage of original barcode sequences.