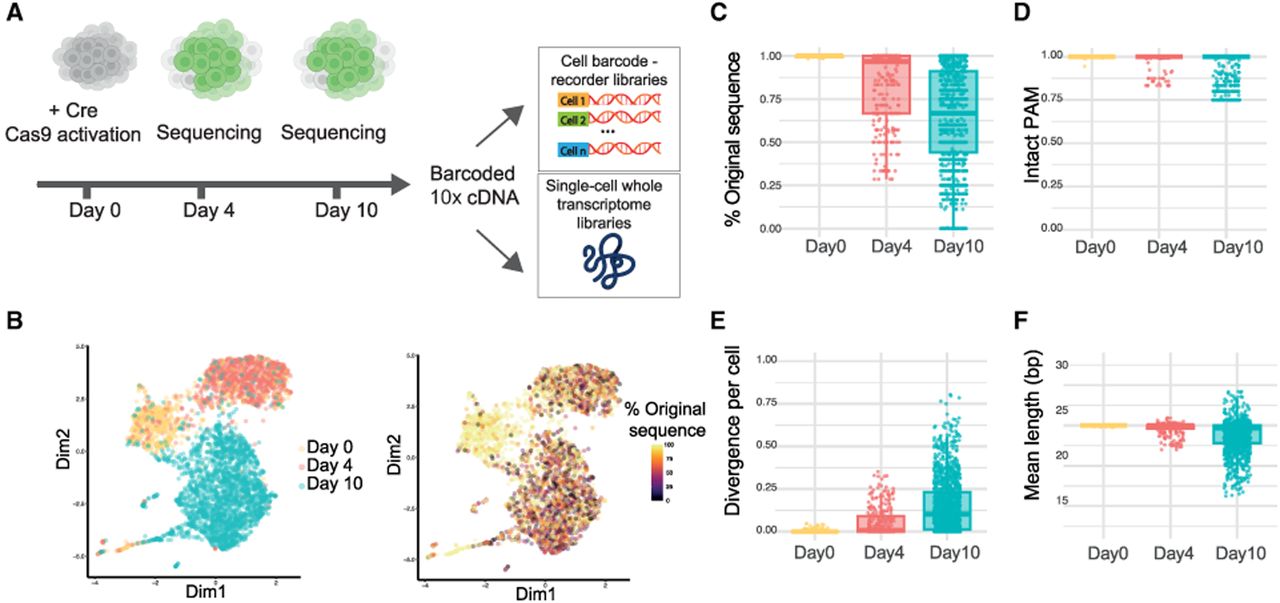
Single-cell readout. (A) Schematic representation of the experimental setup. Double-positive cells were collected at days 0, 4, and 10 after Cre induction and processed using the 10x Genomics platform. Barcoded cDNA was used to prepare two different libraries: (1) a targeted amplicon library enriched for the scDynaBar cassette (“cell barcode–recorder library”) and (2) a whole-transcriptome gene expression library. (B) t-SNE plot colored by cluster: noninduced (day 0) and induced (day 4 or day 10; left). Color indicates the mean percentage of the original barcode sequence per cell (right). (C–F) Box plot of results at days 0 (n = 495), 4 (n = 626), and 10 (n = 1117) showing the percentage of the original barcode sequences per cell (C), the mean proportion of barcodes with full PAM sequence per cell (D), mean barcode divergence from the original barcode sequence per cell (E), and mean length of the barcodes per cell (F). For all box plots, the boxes represent the IQR, with the horizontal line inside each box indicating the median. Each dot represents an individual cell, with data points displayed within the 95% confidence interval.