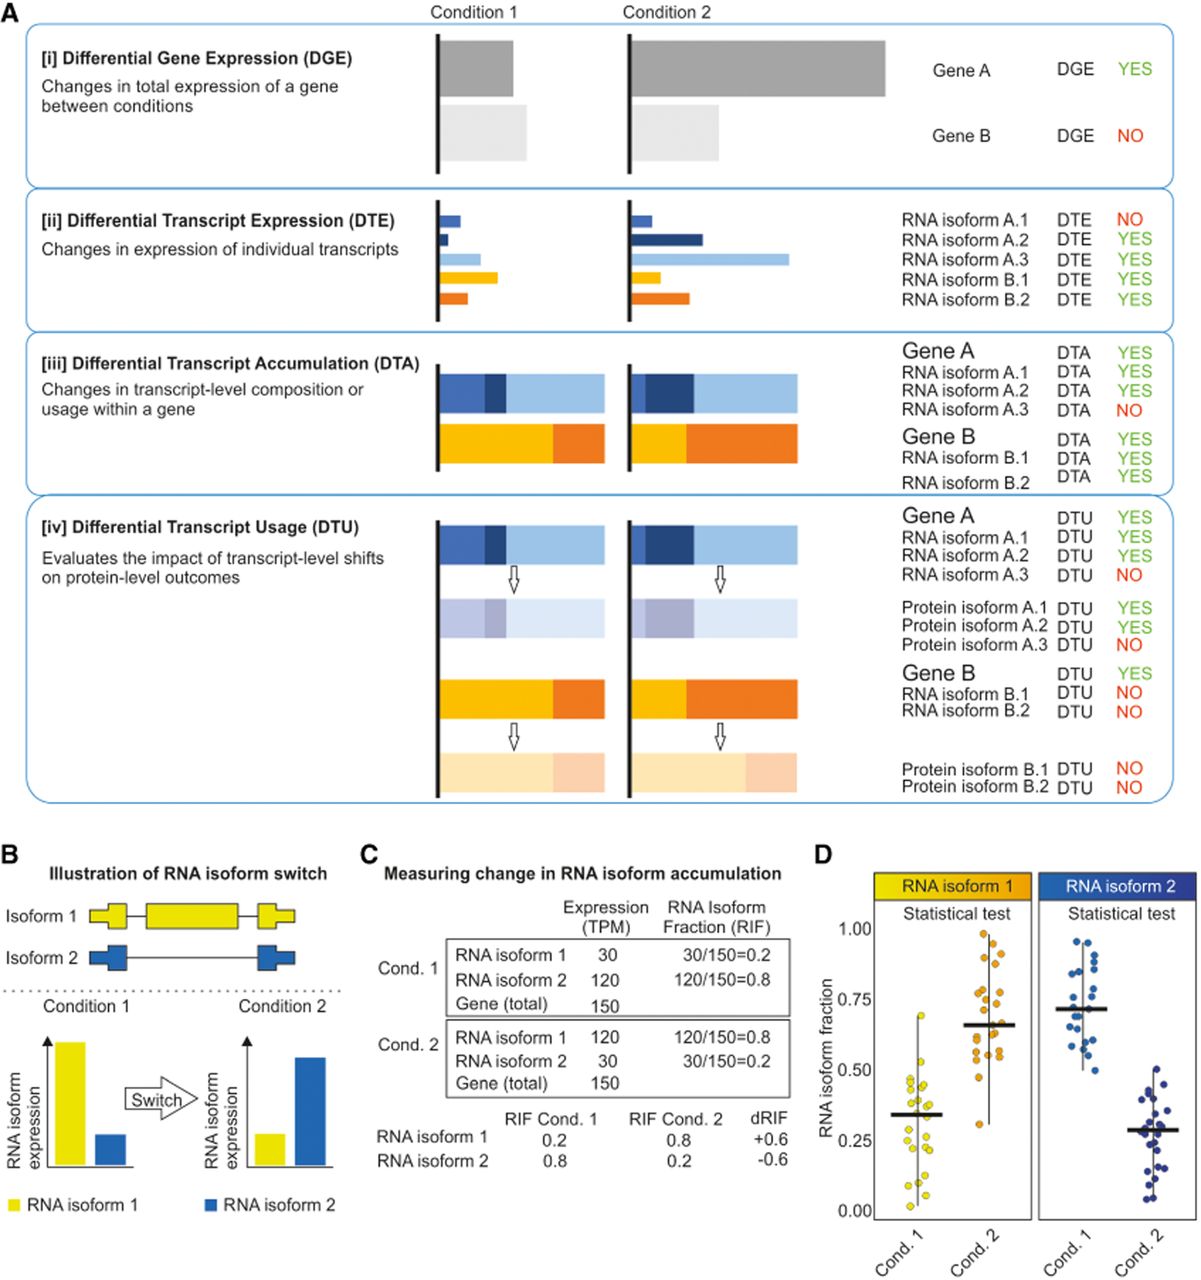
Conceptual framework for distinguishing gene- and isoform-level dynamics. (A) Comparative overview of differential analysis modes in transcriptomics. (B) Schematic representation of an RNA isoform switch. Illustration of a transcript-level isoform switch. (Top) Two RNA isoforms (yellow and blue) transcribed from a single gene locus with visible differences in their exon–intron architecture. (Bottom) Differential expression patterns of these isoforms across two biological states (condition 1 and condition 2). An isoform switch is characterized by a significant shift in the relative abundance of isoforms, in which the dominant transcript in the first condition (isoform 1) is replaced or superseded by an alternative variant (isoform 2) in the second condition. (C) Theoretical examples illustrating the calculation of RNA isoform fraction (RIF) and the difference in RIF (dRIF). (Top) In the tables, isoform-level expression values are provided in transcripts per million (TPM) for two conditions. RIF is determined by the ratio of a specific isoform's expression to the total gene expression (cumulative TPM of all isoforms). (Bottom) The dRIF metric quantifies the magnitude of the isoform switch, defined as the change in RIF values between states (dRIF = RIFCond2 − RIFCond1). (D) Statistical evaluation of RNA isoform fractions across biological replicates. Dot plots illustrate the distribution of RIF for individual isoforms across multiple samples (e.g., individuals) in the compared conditions. This framework allows for the statistical assessment of isoform-level variation by comparing RIF distributions between condition 1 and condition 2 for each specific transcript independently.