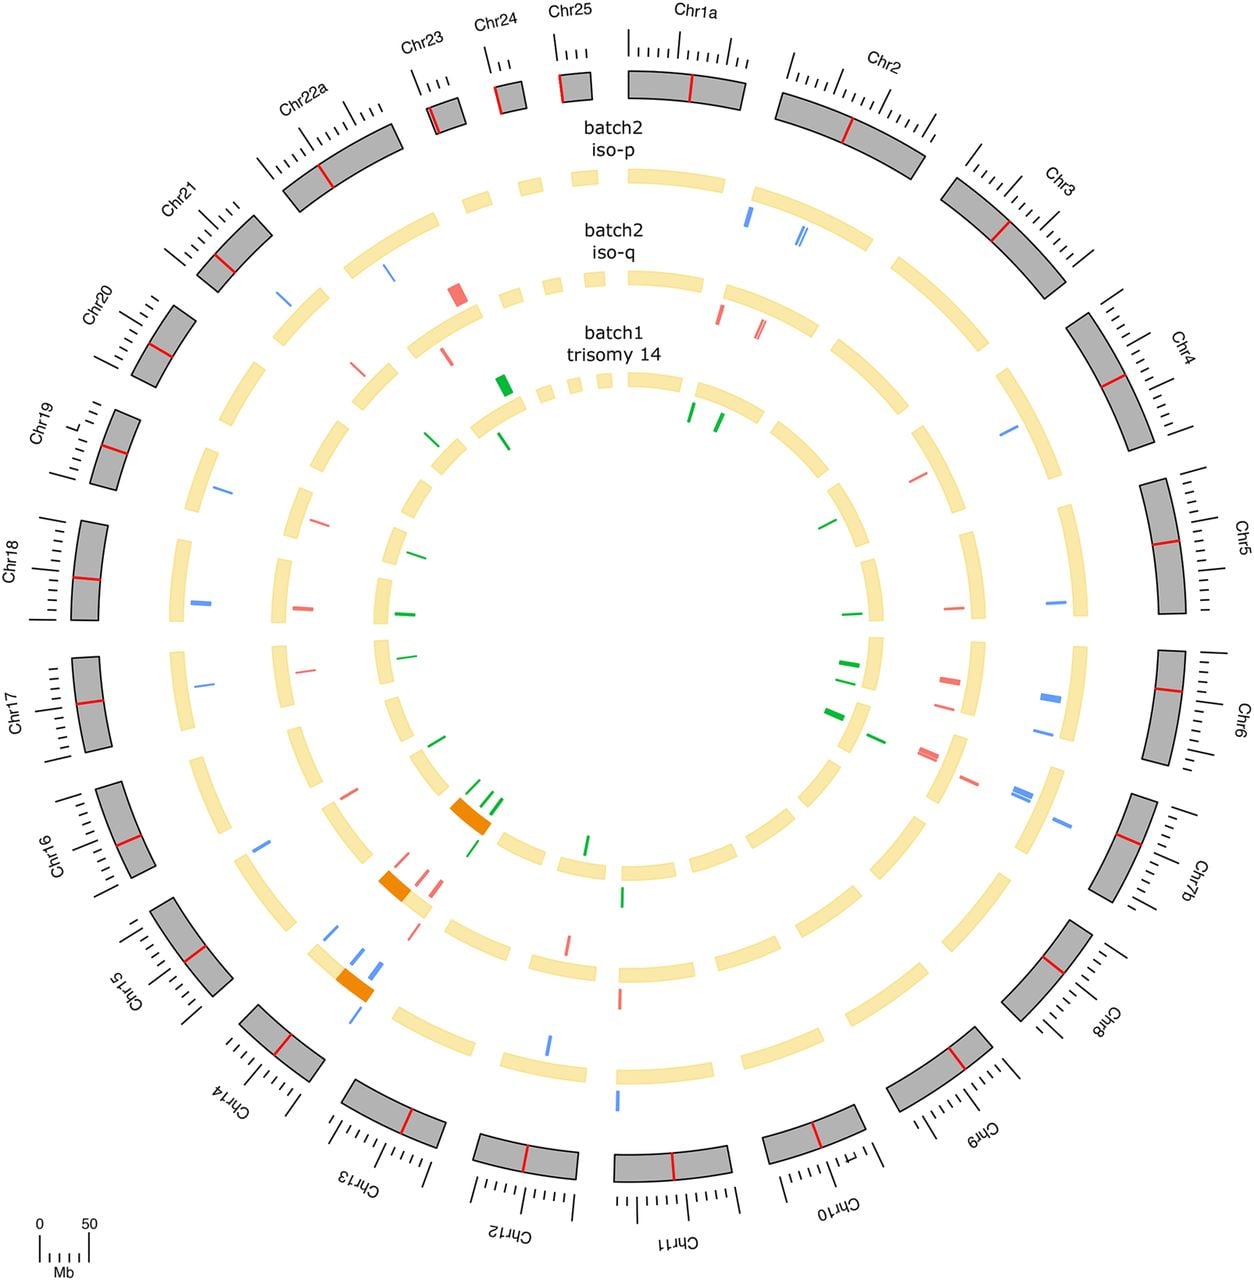
Circular plot displaying the map of chromosomal rearrangements detected by Strand-seq. Each concentric ring represents the read-depth profile (copy number [CN]) across chromosomes for a specific batch: batch1 (innermost ring, green inversions), iso-q subpopulation of batch2 (middle ring, red inversions), and iso-p subpopulation of batch2 (outermost ring, blue inversions). Yellow segments indicate regions with a CN of two, and orange segments mark regions with CN = 3, such as Chromosome 14 (trisomy) and the isochromosome arms in iso-p and iso-q subpopulations. Inversion events are shown as colored bars (green for batch1, red for iso-q batch2, and blue for iso-p batch2): Inversions plotted outside the corresponding ring indicate heterozygous events, and those plotted inside the ring denote homozygous inversions.