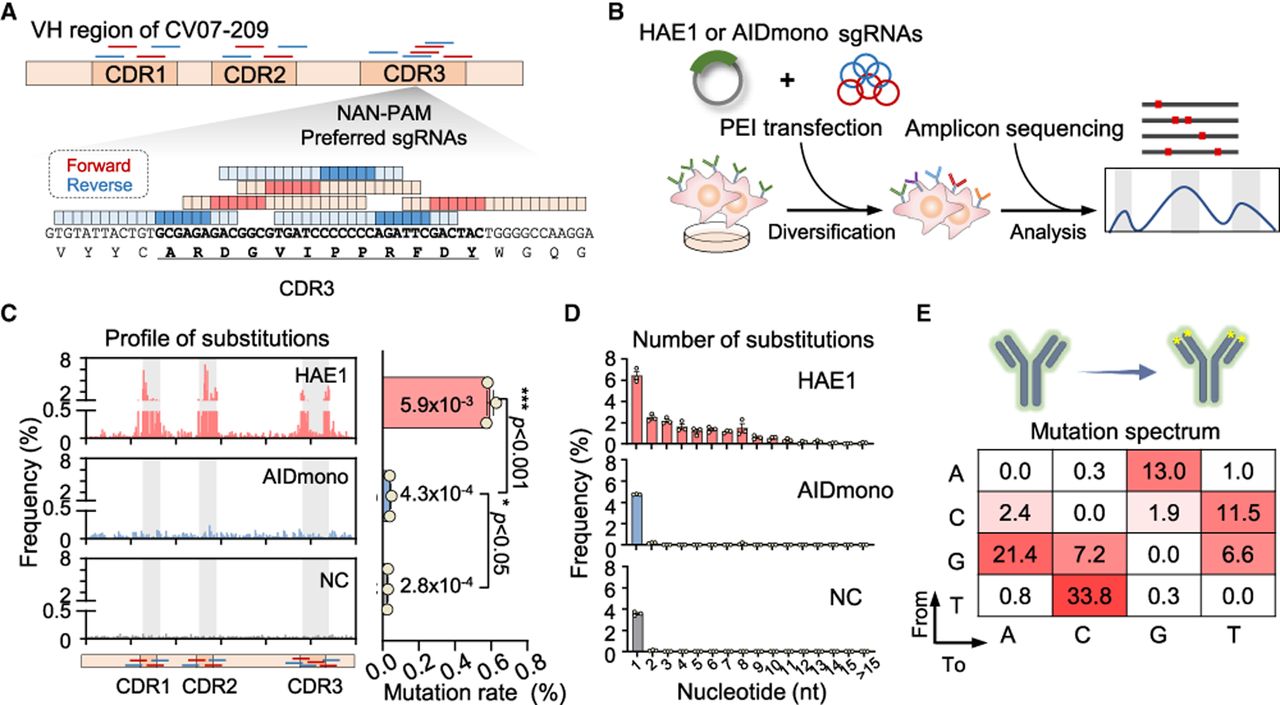
Profiling antibody evolution efficiency via high-throughput sequencing. (A) A schematic diagram illustrating the design of sgRNAs targeting the heavy chain variable region (VH region) of CV07-209, with a magnified view of the CDR3 region. The editing windows of each sgRNA are highlighted. (B) A schematic diagram illustrating the antibody diversification workflow. HAE1 or AIDmono was cotransfected with a mixture of sgRNAs targeting VH region by PEI. Genomic DNA was extracted 72 h posttransfection for amplicon sequencing to evaluate substitution efficiency and mutation spectrums. (C) Substitution profiles during antibody diversification generated by HAE1 or AIDmono, as detected by amplicon sequencing (left). The y-axis shows the mean substitution frequency at each nucleotide, derived from three independent replicates. CDR1, CDR2, and CDR3 are shaded in gray, with corresponding sgRNAs targeting these regions shown below. NC, negative control with untreated groups. Average mutation rate of sgRNA-covered region (right). Statistical analysis was performed using a paired two-tailed t-test, with P values indicated. (D) Proportion of antibody mutants with different numbers of substitutions. Data are presented as mean ± SEM with three independent replicates. (E) The mutation spectrum generated by HAE1 during antibody diversification. The sequence regions covered by sgRNAs were assessed for each type of base substitution (the number of each type of substitution divided by the total substitutions of four nucleotides within the sgRNA-covered region). Data are represented as the average value from three independent replicates.