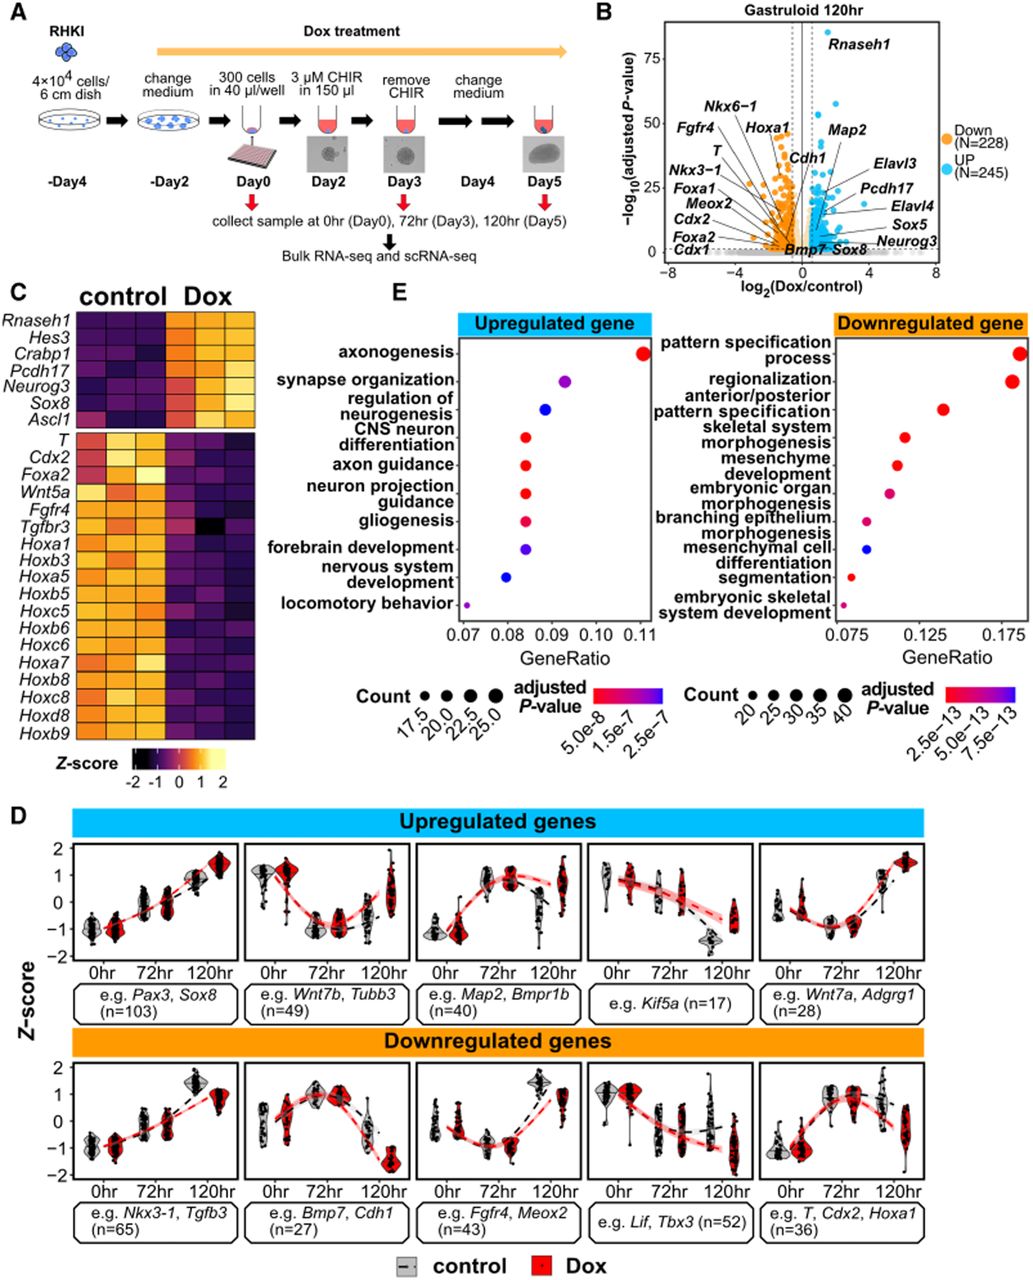
Key developmental regulators are dysregulated in gastruloids from R-loop-depleted mESCs. (A) Gastruloid differentiation protocol and collection time points for bulk RNA-seq and scRNA-seq. Rnaseh1 was induced at day –2 for 2 days prior to differentiation. At day 0, cells were replated for gastruloid differentiation (see Methods). At day 2, CHIR was added for 1 day to stimulate WNT signaling. (B) Volcano plot of bulk RNA-seq data (n = 3 replicates per condition) at 120 h of gastruloid differentiation, indicating changes in gene expression upon Rnaseh1 overexpression. Upregulated (n = 228) and downregulated genes (n = 245) are highlighted in blue and orange, respectively (|log2FC| ≥ 0.58, adjusted P-value ≤ 0.05). (C) Example upregulated and downregulated genes at 120 h. Gene expression differences between control and Rnaseh1-overexpressing cells are shown as Z-scores. Three replicates for each condition were performed. (D) Violin plots of examples of upregulated and downregulated genes at 0, 72, and 120 h with a regression line to indicate the temporal expression pattern. Patterns were identified by k-means clustering. (E) Dotplots of GO analysis results showing with top 10 GO-terms for upregulated and downregulated genes. GO categories shown are with a Q-value ≤ 0.05.