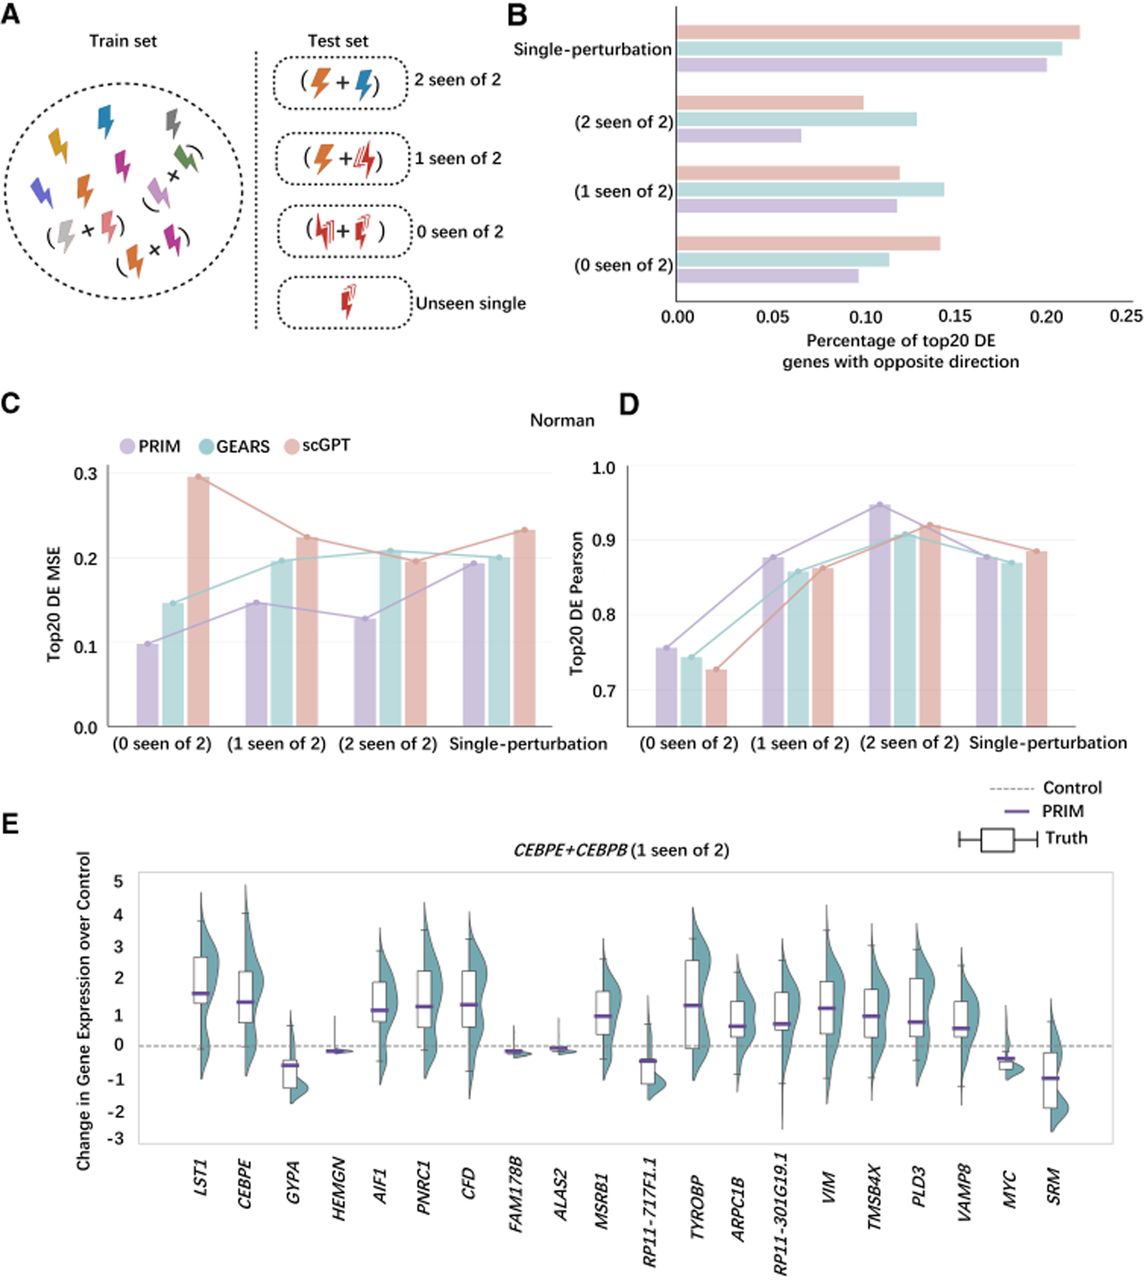
Training-test perturbation partitioning on the Norman data set with combined perturbations and performance comparison across models. (A) Schematic of the training-test partitioning strategy for combined perturbations, along with a single perturbation test subset divided out as shown in Figure 3A, resulting in four test subsets in total. (B) Percentage of incorrect predictions by different models regarding the direction of change in the top 20 differentially expressed genes across each test subset. (C) Comparison of MSE metrics of different models for predicting the top 20 differentially expressed genes across each test subset. (D) Comparison of Pearson's correlation metrics of different models for predicting the top 20 differentially expressed genes across each test subset. (E) Visualization of the predicted changes in the top 20 differentially expressed genes from PRIM relative to control cells compared with the true values under the perturbation combination CEBPE+CEBPB.