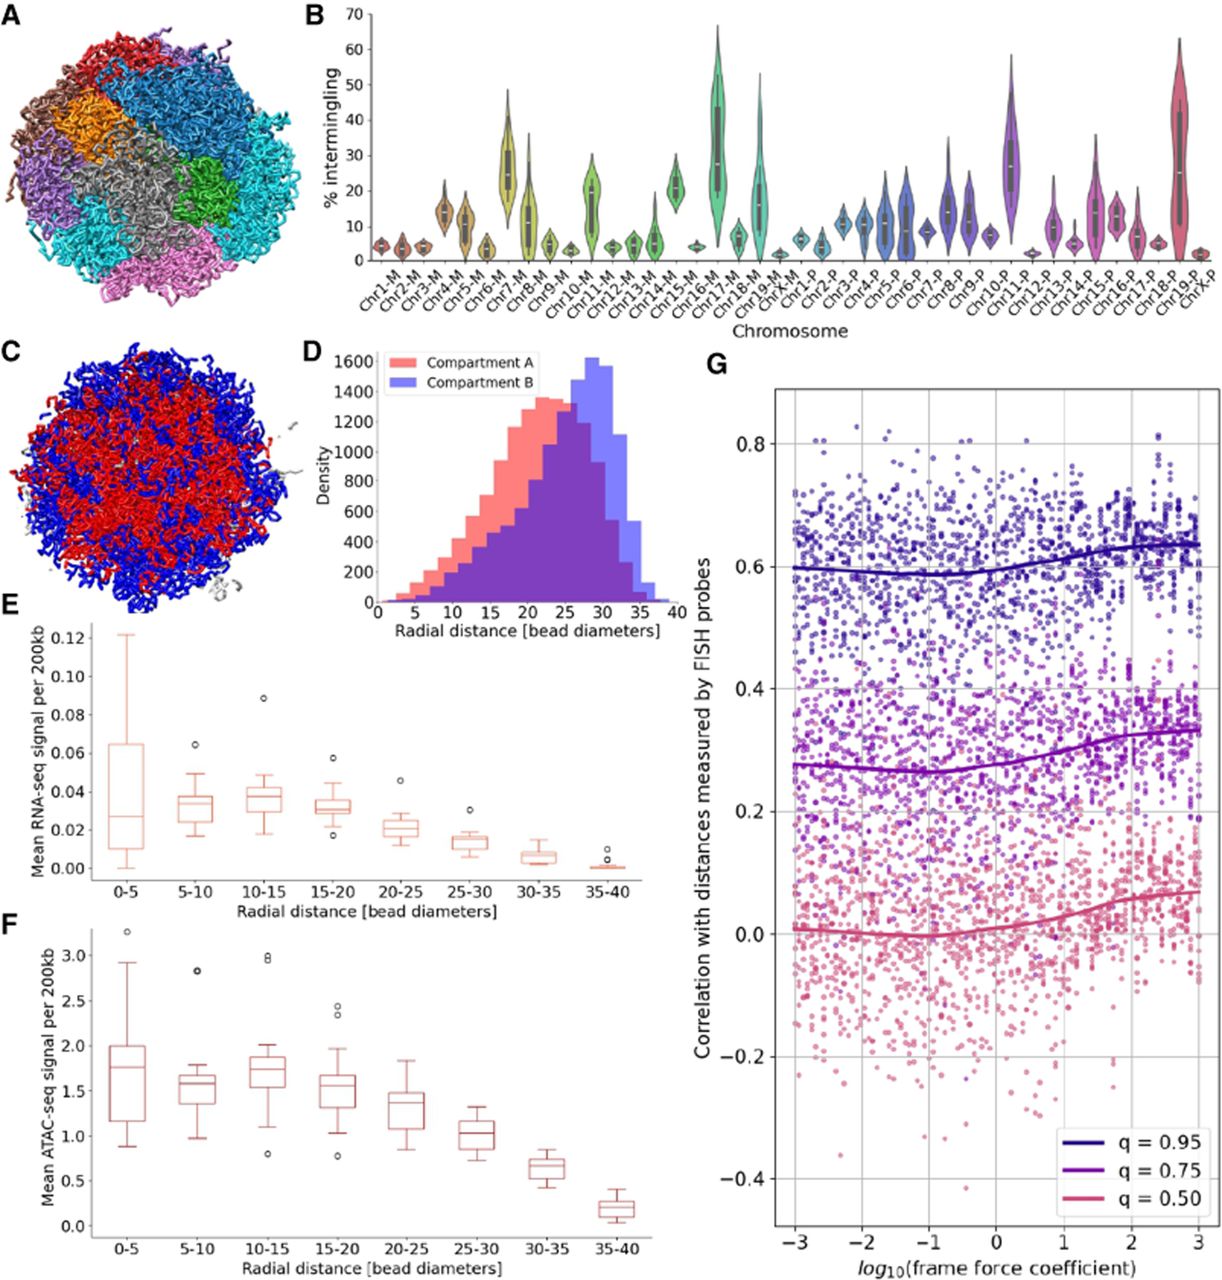
Analysis of ChromMovie-derived structural features using single-cell data. (A) ChromMovie reconstruction of a single-cell, whole-genome diploid mouse nucleus. Individual chromosomes are shown in distinct colors to visualize chromosomal territories. (B) Quantification of interchromosomal intermingling based on the structure in A. Maternal chromosomes are labeled with the suffix “-M”; paternal chromosomes, with “-P.” (C) ChromMovie model of the same cell highlighting chromatin compartmentalization. Compartment A (red) and compartment B (blue) are visualized in a central nuclear cross-section. Gray segments represent regions with unknown compartment (mostly centromeres and telomeres). (D) Radial distribution of compartments A and B based on the model in C, demonstrating preferential localization of active (A) and inactive (B) regions within the nuclear volume. (E) Radial distribution of RNA-seq signal from the ChAIR data set, showing that transcriptionally active regions are enriched closer to the nuclear center. (F) Radial distribution of ATAC-seq signal from the same data set, indicating increased chromatin accessibility near the nuclear interior. (G) Validation of ChromMovie structural models using 3D-FISH probe data from Beagrie et al. (2017). Each point represents a unique combination of cell, frame force coefficient, and the corresponding quantile (0.50, 0.75, or 0.95) of the correlation distribution between modeled and experimental distances. Loess trend lines are shown for each quantile to highlight the effect of frame force regularization.