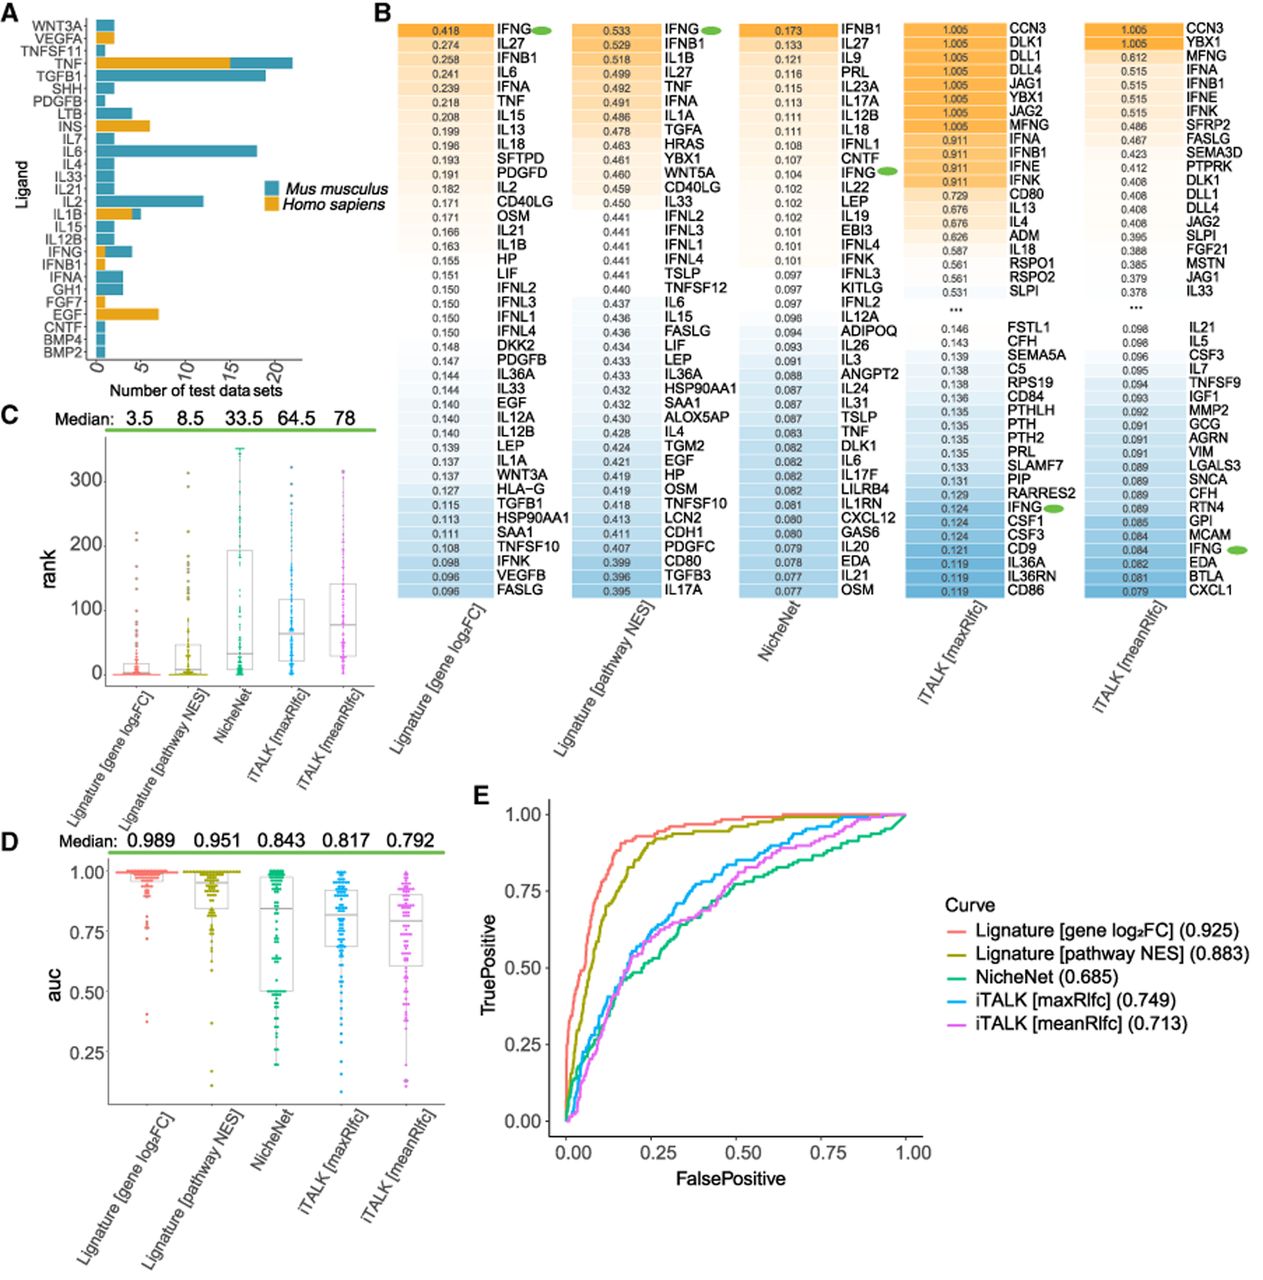
Comparison of Lignature to other methods in signaling inference with bulk in vitro data sets. (A) A total of 90 transcriptomic data sets of ligand-treated cell lines were used as test data sets, including 24 human and 66 mouse data sets representing 27 unique treatment ligands. (B) Top-ranked ligands (among all ligands included in Lignature) and the corresponding ligand scores of an example test data set treated with IFNG, predicted from gene-level signatures, pathway-level signatures, and three other methods. (C) Ranks of the actual treatment ligands among all ligands included in Lignature of 90 test data sets predicted by each method. (D) AUC values of the ROC curves for predictions of the 90 test data sets from each method. (E) ROC curves and the corresponding AUC values for combined predictions of all the 90 test data sets from each method. In this in vitro setting, true positives are defined as the experimentally added ligands, whereas false positives correspond to all other ligands.