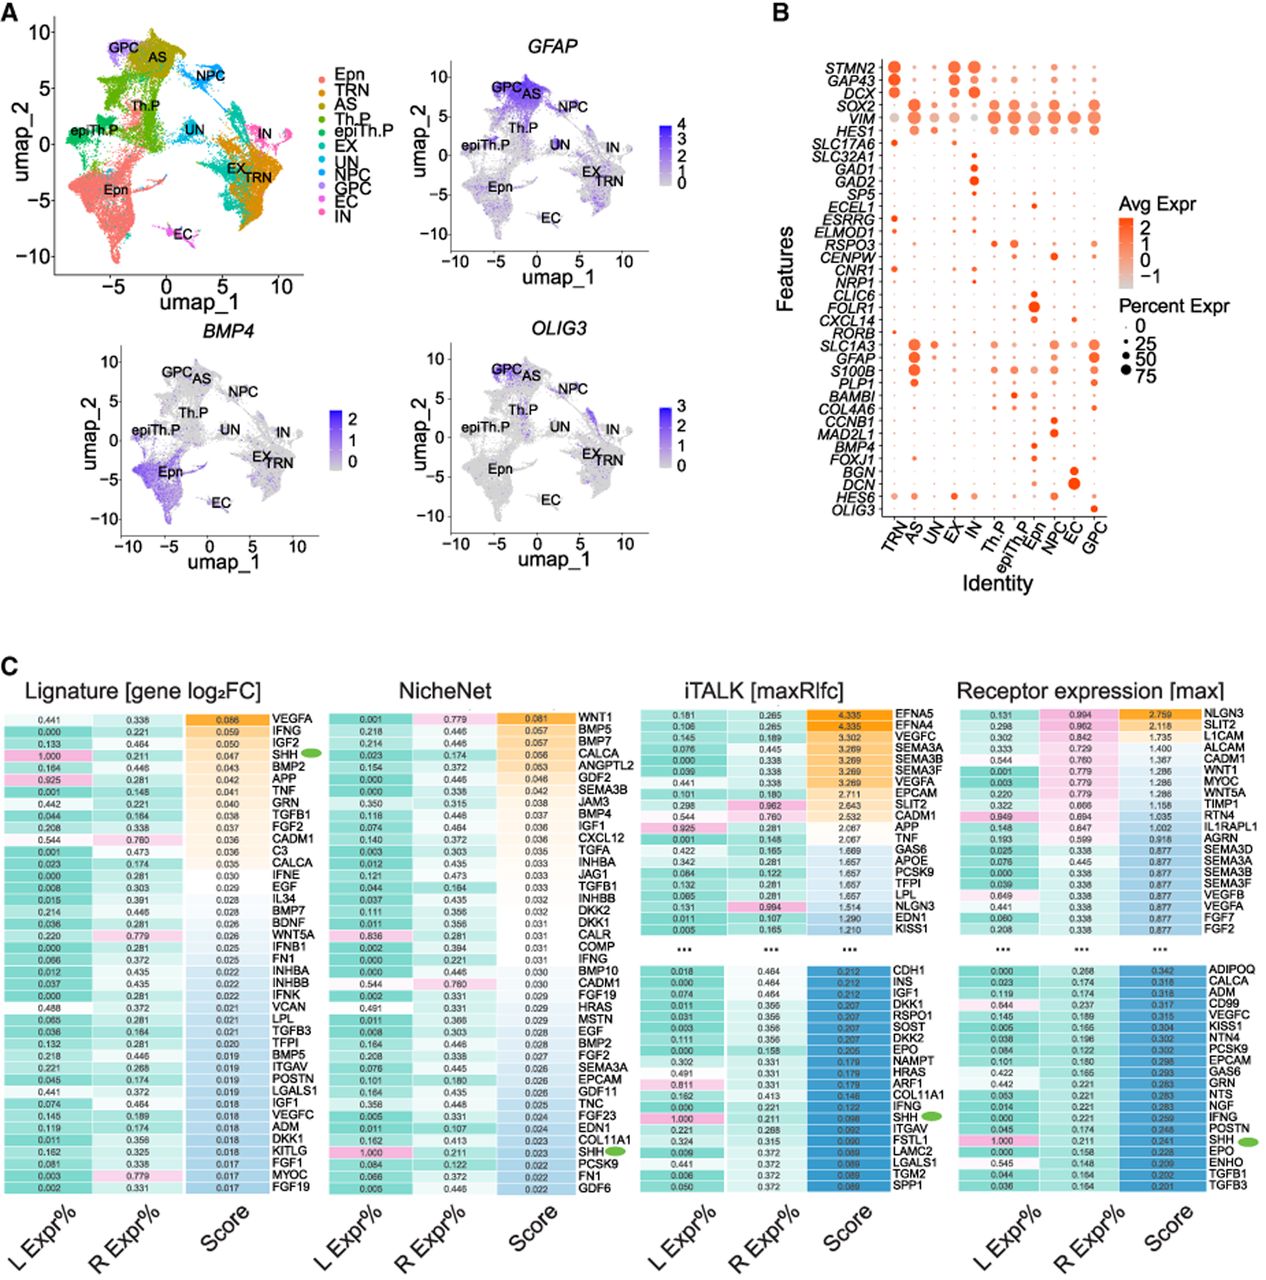
Figure 4.
Application and assessment of Lignature on the SHH-induced thalamic differentiation scRNA-seq data set. (A,B) UMAP dimensionality reductions, example feature plots, and DotPlot of selected marker genes of major cell clusters of the SHH-induced thalamic differentiation scRNA-seq data set. (C) The top predicted ligand scores obtained for the IN cells. The transcriptomes from the SHH day 14–22 treatment samples were compared with untreated samples, and transcriptional program–associated ligands were predicted using Lignature alongside three other methods. The first column shows the detection rates of the ligands across all cells, and the second column shows the maximum detection rate of their cognate receptors in IN cells.