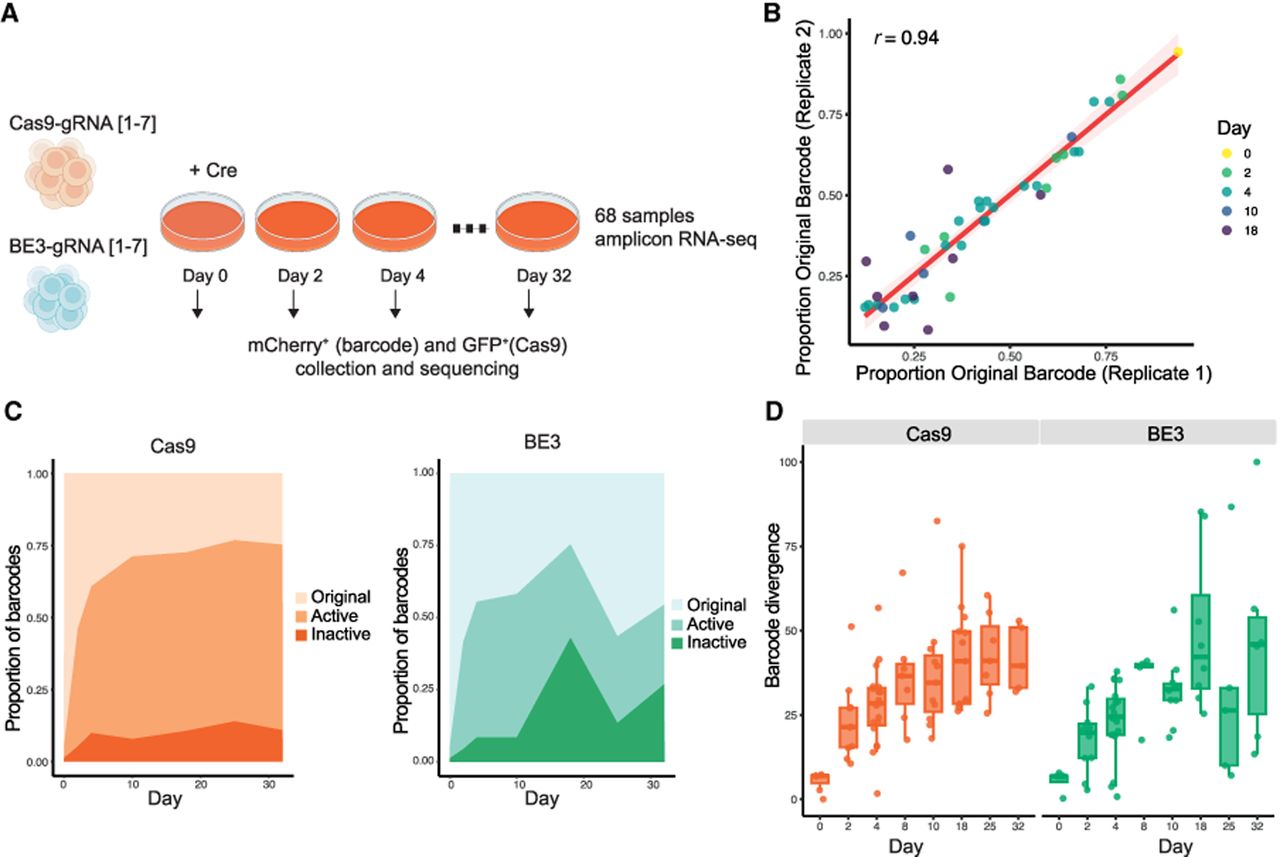
Reproducibility of barcode dynamics between two different replicates and window of activity. (A) Schematic representation of the experimental setup. Double-positive cells were defined as GFP+ (Cas9) and mCherry+ (Barcode) cells and were collected by FACS at all sequenced time points (days 0, 2, 4, 8, 10, 18, 25, and 32). In total, 68 replicate-2 libraries with coverage of more than 200 reads were analyzed (39 Cas9 and 29 BE3; see section “Bulk barcode analysis” in the Methods. (B) Scatter plot of original barcode frequencies in independent biological replicates. Each point represents one biological condition (defined by gRNA, experiment type, and time point), with replicate 1 on the x-axis and replicate 2 on the y-axis. Points are colored by day. A total of 86 samples were analyzed, including 50 from the Cas9 experiment and 36 from the BE3 experiment. The Pearson correlation coefficient between replicates is r = 0.94. (C) Proportion of barcodes based on their mutational profile: edits on the protospacer with intact PAM motif (active), lack of PAM motif (inactive), and uncut gRNA (original) according to Cas9 (left) or BE3 (right). Data represent the average across all seven gRNAs (Cas9 n = 39; BE3 n = 29). (D) Barcode divergence from the original barcode sequence over time, considering mismatches, gaps, and gap extensions, pooling all gRNA for Cas9 (left) and BE3 (right). Sample size (left to right): for Cas9, n = 7, 10, 19, 7, 11, 7, 13, and 5; for BE3, n = 8, 10, 19, 5, 8, 5, and 6. For all box plots, the boxes represent the interquartile range (IQR), with the horizontal line inside each box indicating the median.