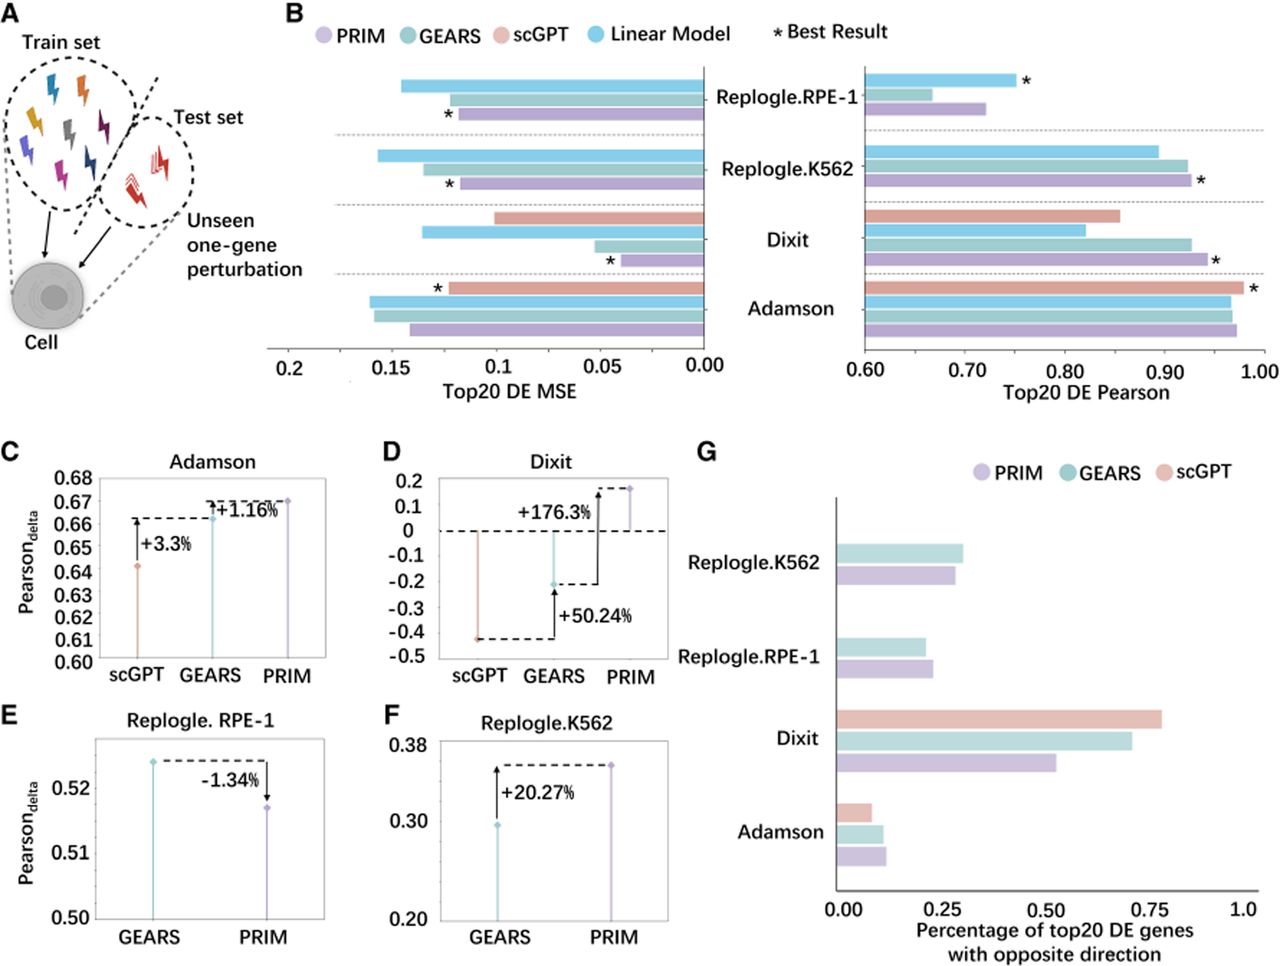
Training-test perturbation partitioning and performance comparison across single-perturbation data sets (Adamson, Dixit, Replogle.RPE-1, and Replogle.K562). (A) Schematic of the training-test perturbation partitioning strategy for single-perturbation data sets. (B) Comparison of Pearson's correlation and MSE metrics for different models in predicting the top 20 differentially expressed genes. Higher Pearson's correlation indicates better performance, and the same applies below. (C–F) Performance comparison of different models based on the Pearsondelta metric across single-perturbation data sets. A higher Pearsondelta indicates better performance. (C) Adamson. (D) Dixit. (E) Replogle.RPE-1. (F) Replogle.K562. (G) Percentage of incorrect model predictions regarding the direction of change in the top 20 differentially expressed genes. Lower values of this metric indicate better performance, and the same applies below.