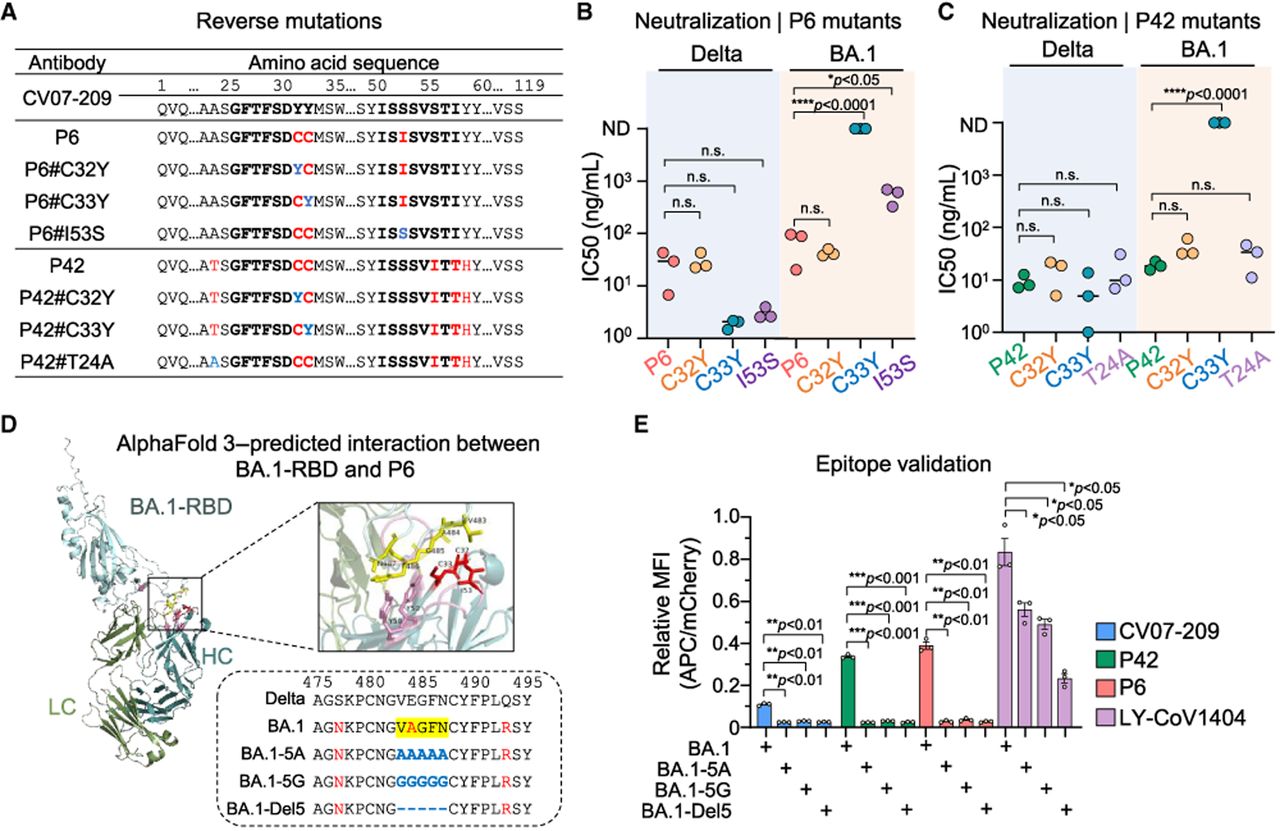
Both deaminases in HAE1 facilitate antibody affinity maturation. (A) Amino acid sequences of P6 and P42 with single reverse mutations. Mutations introduced by HAE1 are colored in red and reverse mutations are colored in blue. (B,C) Neutralization potency of reverse mutants of P6 (B) and P42 (C). IC50 values were calculated using GraphPad Prism software for nonlinear regression analysis, with each data point representing an individual biological replicate. Values >10,000 ng/mL or those with unstable fits are considered as nondetectable (ND). Statistical analysis was performed using an unpaired two-tailed t-test, with P values indicated or noted as not significant (n.s.) if P > 0.05. (D) AlphaFold 3-predicted structure of P6 bound to the BA.1 RBD protein. The box shows an enlarged view of the interaction surface between the antibody heavy chain and the RBD. Predicted interacting residuals from RBD are highlighted in yellow, and mutations in the antibodies are colored in red. The potential S protein epitope recognized by CV07-209 is indicated on the bottom box. (E) Relative binding efficiency of antibodies with the indicated epitope mutations. Data are presented as the ratio of mean fluorescence intensity (MFI) of antibody binding (APC) to antigen expression levels (mCherry). Statistical analysis was performed using a paired two-tailed t-test, with results shown as mean ± SEM from three biological replicates. P values are indicated or noted as not significant (n.s.) if P > 0.05.