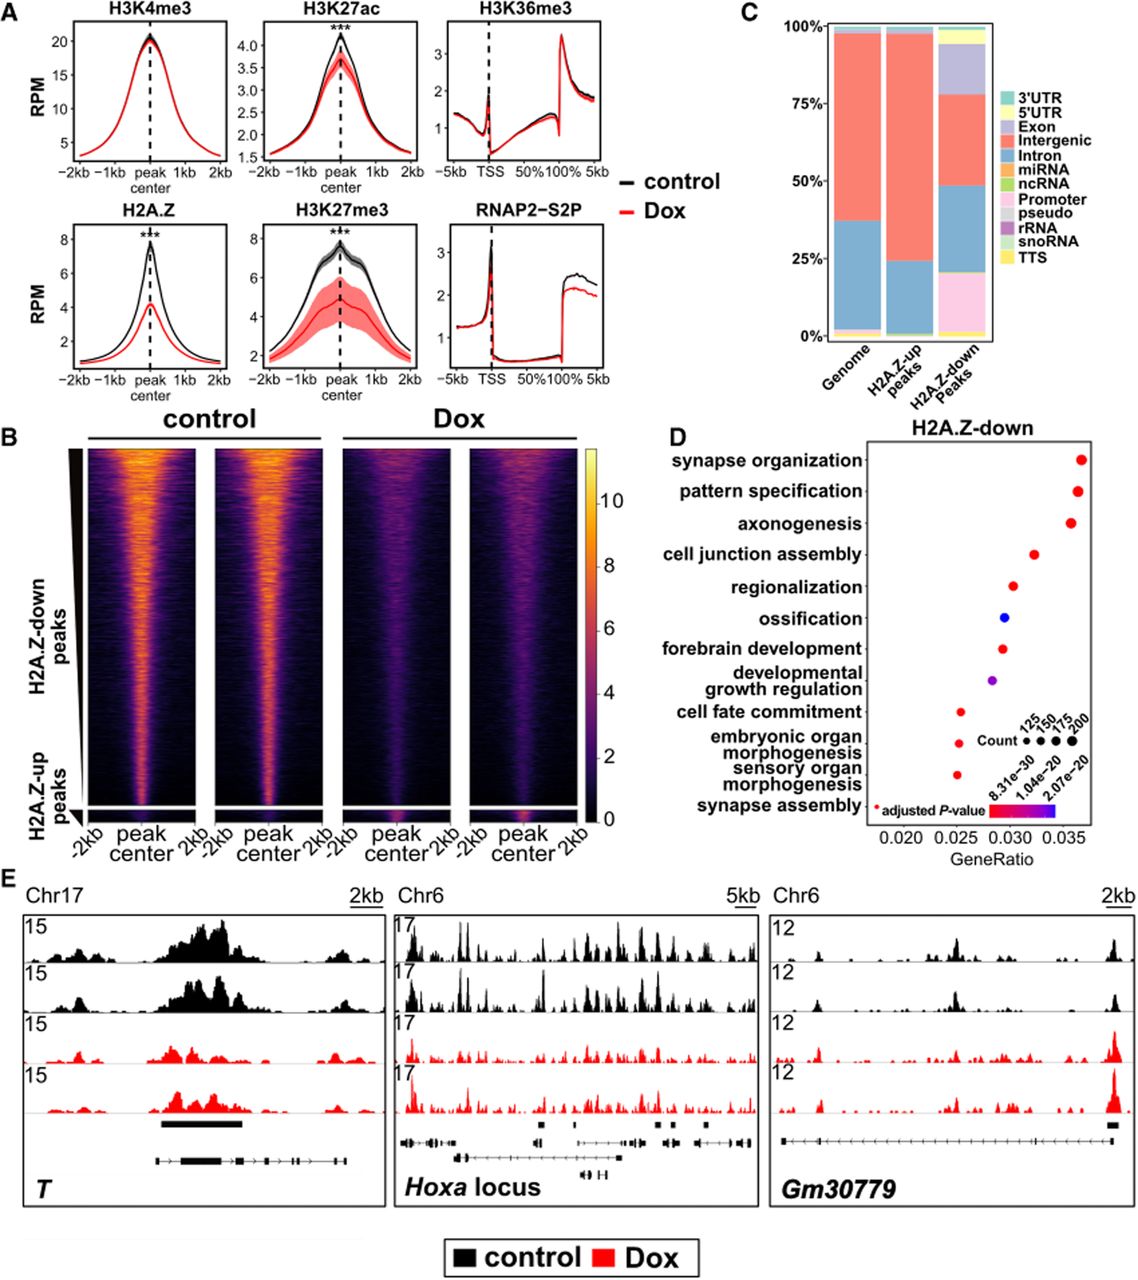
R-loop depletion causes genome-wide changes in H2A.Z occupancy in mESCs. (A) Enrichment of R-loop-associated epigenetic features. Aggregation plots of indicated features, measured by CUT&Tag (n = 4 replicates for H2A.Z, H3K27me3, and H3K36me3 and n = 2 for all other epitopes), surrounding peak centers from published ChIP-seq data obtained from GEO (H3K4me3 and H3K27ac: GSE31039; H3K27me3: GSE123174; H2A.Z: GSE34483) or metagene profiles over gene bodies (H3K36me3 and RNAP2-S2P). Aggregation plots measuring the mean reads per 10 million were generated for each replicate, and the mean and standard error of mean for all replicates are shown. (***) P < 0.001, determined as described in the Supplemental Methods. (B) Heatmaps illustrating H2A.Z signal across peak centers of H2A.Z-down and H2A.Z-up peaks that differ between control and Dox treatment (defined with fold change of two or more and FDR ≤ 0.05). Two representative replicates of each condition are shown. (C) Quantification of genomic features of peaks belonging to the H2A.Z-up or H2A.Z-down peak set. The distribution of features across the mouse genome, denoted as “genome,” is shown for reference. (D) Dotplot of GO category enrichment of the top 12 GO-terms of genes near H2A.Z-down peaks. A Q-value ≤ 0.05 was used as the cutoff for GO category enrichment. (E) Genome browser tracks illustrating the effect of ectopic Rnaseh1 induction on H2A.Z enrichment. Black bars above gene models indicate significantly changed peaks. Two replicates each for control and Rnaseh1-induced (Dox) mESCs are shown.