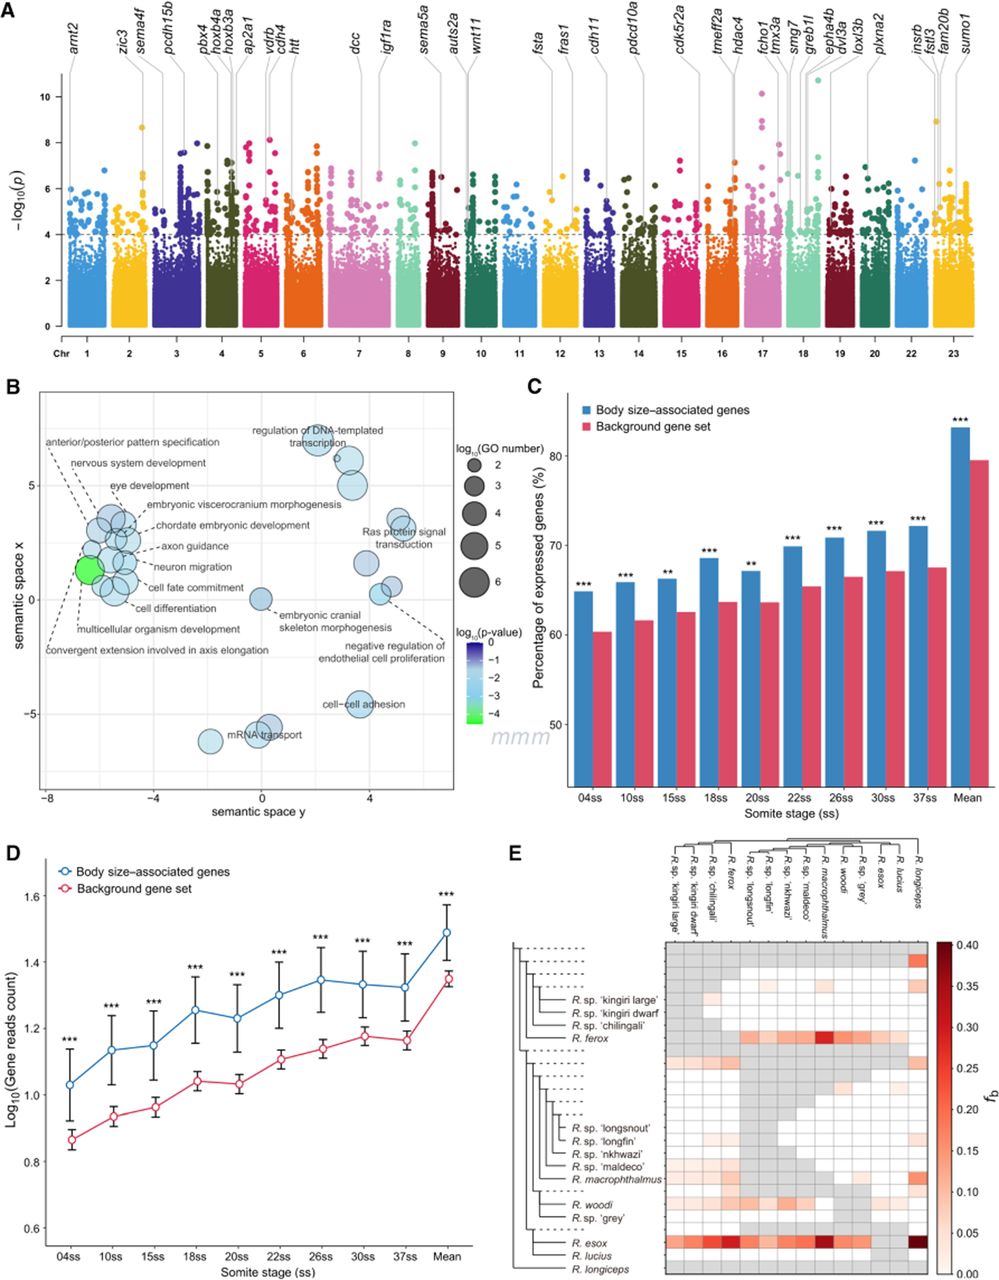
Association of skeletal and nervous system development with body size evolution. (A) GWA results for the body size for all 2,816,637 polymorphic SNPs within the Rhamphochromis radiation across 66 individuals. The y-axis corresponds to two-tailed −log10(P-values); the x-axis corresponds to genomic coordinates (fAstCal1.2). The horizontal dashed line reflects the threshold for calling genome-wide significant SNPs (P = 1 × 10⁻⁴). (B) Gene Ontology (GO) scatterplot constructed using REVIGO for all the GO terms and genes within the identified significant SNPs for body size. Bubble size indicates the relative frequency of the GO terms, and bubble color represents log10 P-values (smaller values indicate lower P-values). (C,D) Transcriptomic analysis of the genes significantly associated with body size evolution during early embryogenesis of Rhamphochromis sp. “chilingali,” showing higher proportion of expression (C) and higher expression level (D) for genes associated with body size evolution. (E) Heatmap showing the estimated admixture fractions between pairs of species represented on the x- and y-axes. Species are arranged along the axes according to their placement in the species tree. The matrix values (fb) were calculated using Dsuite's f-branch statistic, which quantifies excess allele sharing between the branch specified on the expanded tree along the y-axis (relative to its sister branch) and the species identified on the x-axis. These values provide insights into the hybrid origin of shared alleles. Gray squares indicate comparisons that cannot be made.