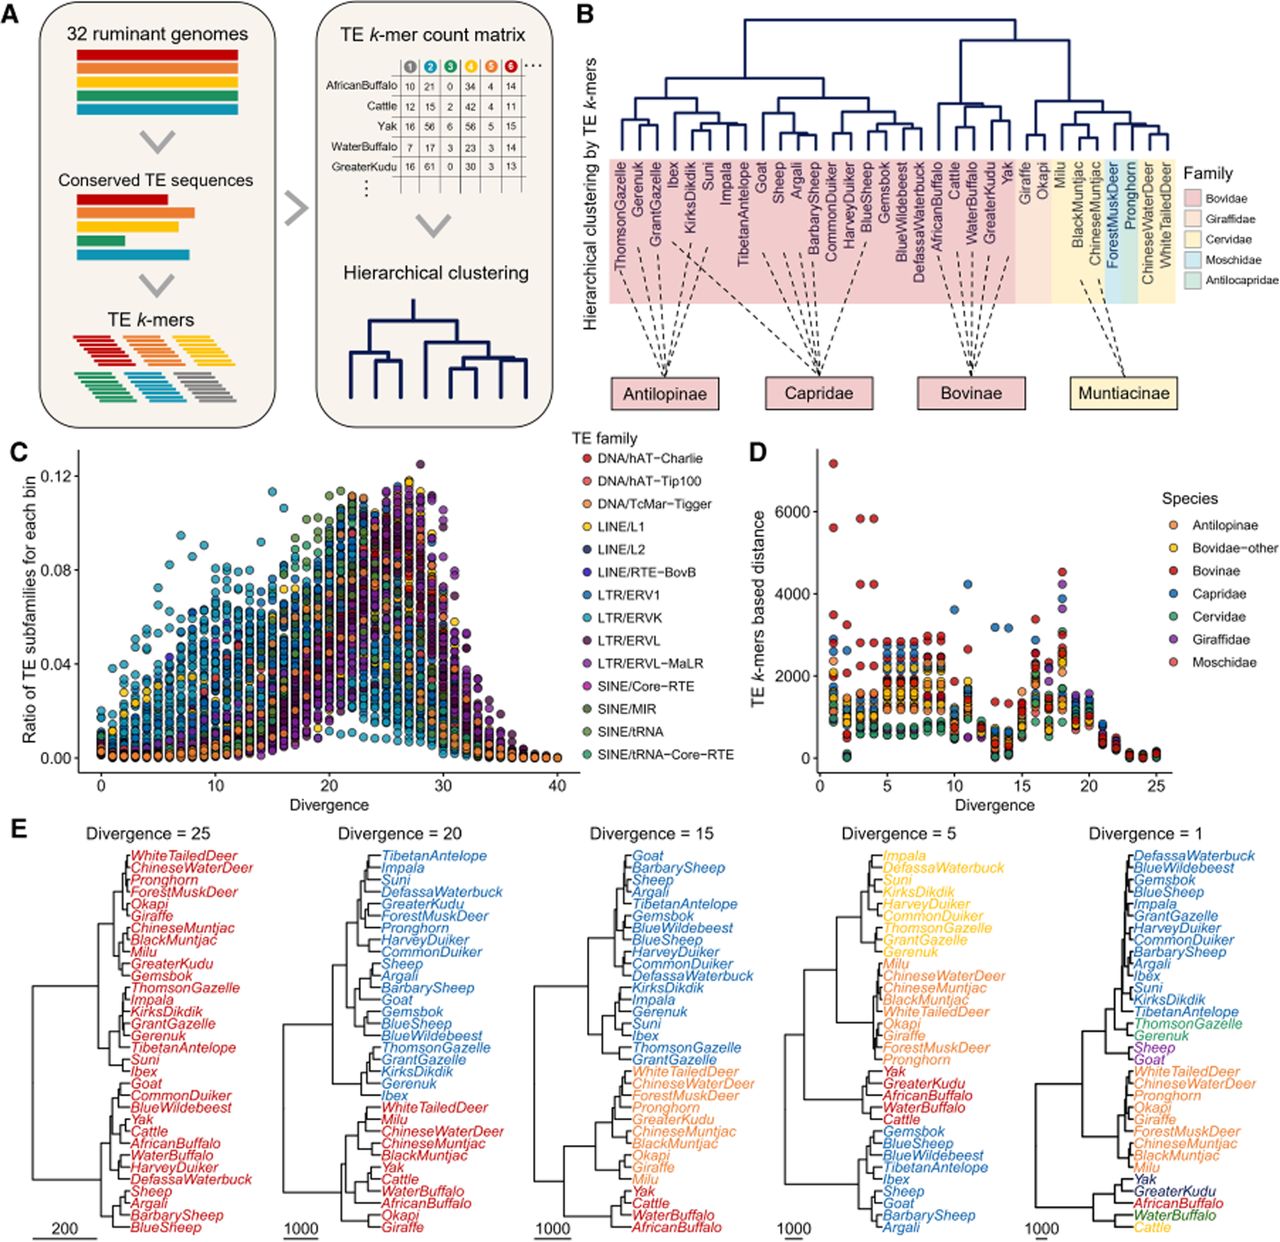
Evolutionary dynamics of TE families across ruminants based on k-mer-based analyses. (A) Reference-free TE subfamily clustering pipeline. Schematic workflow for identification and comparison of TE subfamilies using k-mer frequency spectra. This approach enables cross-species comparison of TE landscapes without genome assembly, highlighting shared and taxon-specific TE distributions. (B) Hierarchical clustering of ruminant species based on TE-derived k-mers. Unrooted tree illustrating phylogenetic relationships inferred from genome-wide TE k-mer similarity. (C) Correlation between TE subfamily expansion and evolutionary age. Dot plot depicting the proportional abundance of TE subfamilies (y-axis) relative to their estimated evolutionary ages (x-axis, inferred from Kimura divergence). Dots are binned by divergence intervals, revealing episodic bursts of TE activity. (D) Pairwise k-mer distance comparison of Pronghorn (Antilocapridae) TEs. Dot plot showing genetic distances (y-axis) between Pronghorn and other ruminant families based on TE k-mer profiles. (E) Phylogenetic trees of 32 ruminant species reconstructed from TE k-mers at varying divergence thresholds. Phylogenetic topologies generated using TE k-mers filtered at divergence levels of 1%, 5%, 15%, 20%, and 25%. For each phylogenetic tree, different colors distinguish major taxonomic groups at various divergence levels.