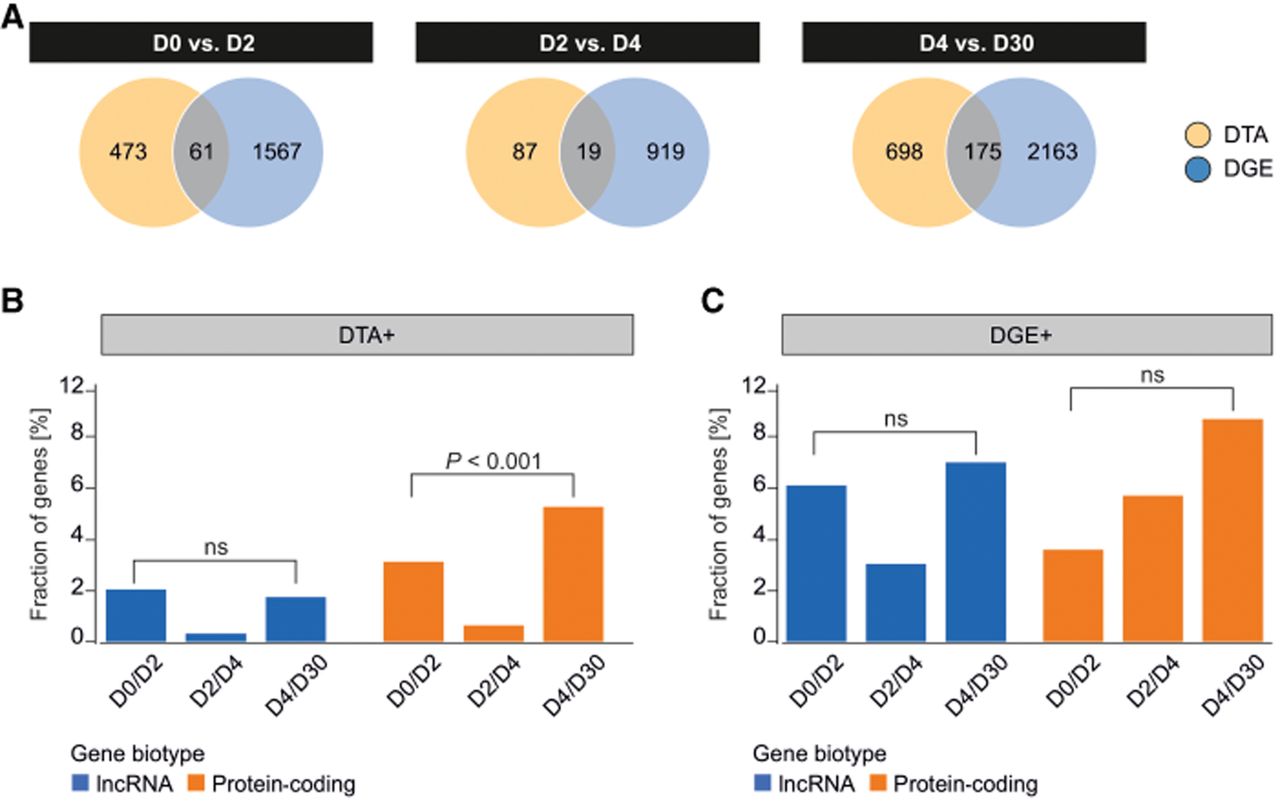
Figure 4.
Distribution of DGE and DTA. (A) Number of genes displaying DGE (blue) or DTA (yellow) during the iPSC-to-iCM differentiation. The overlapping region shows several genes displaying both DGE and DTA, Percentage of lncRNA (blue) and mRNA coding (orange) genes displaying DGE (B) or DTA (C) during the iPSC-to-iCM differentiation. Statistical significance was calculated with a Student's t-test (n = 16). (D0, D2, D4, D30) Days of differentiation.