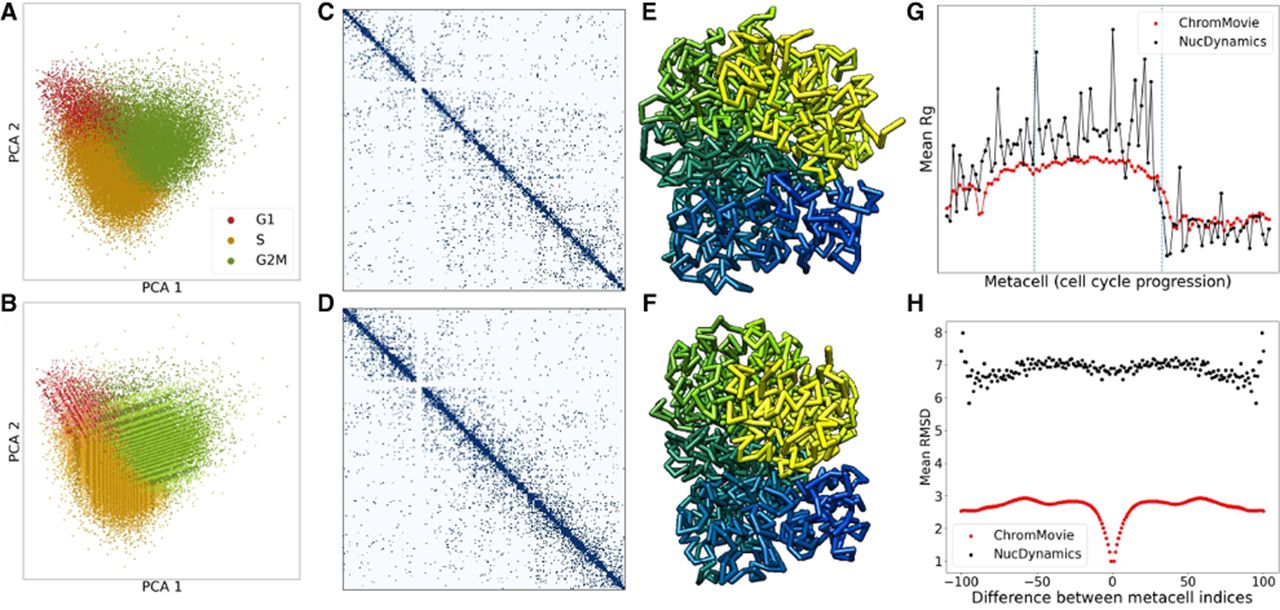
Validation of ChromMovie using ChAIR data. (A) Visualization of single-cell ChAIR data for the K562 cell line using 2D principal component analysis (PCA) (see Chai et al. 2025). (B) The same single-cell data with metacells highlighted as alternating stripes to indicate grouping. (C,D) Representative single-cell contact maps for Chromosome 12, illustrating a more relaxed chromatin state during the S phase (C) and a more condensed state in the G2M phase (D). (E,F) Corresponding 3D chromatin structures generated by ChromMovie for the contact maps shown in C and D, respectively. (G) The mean radius of gyration across all 102 metacells throughout cell cycle progression, comparing ChromMovie and NucDynamics. (H) Mean RMSD values plotted as a function of frame shifts, assessing structural consistency between consecutive frames in both ChromMovie and NucDynamics models.