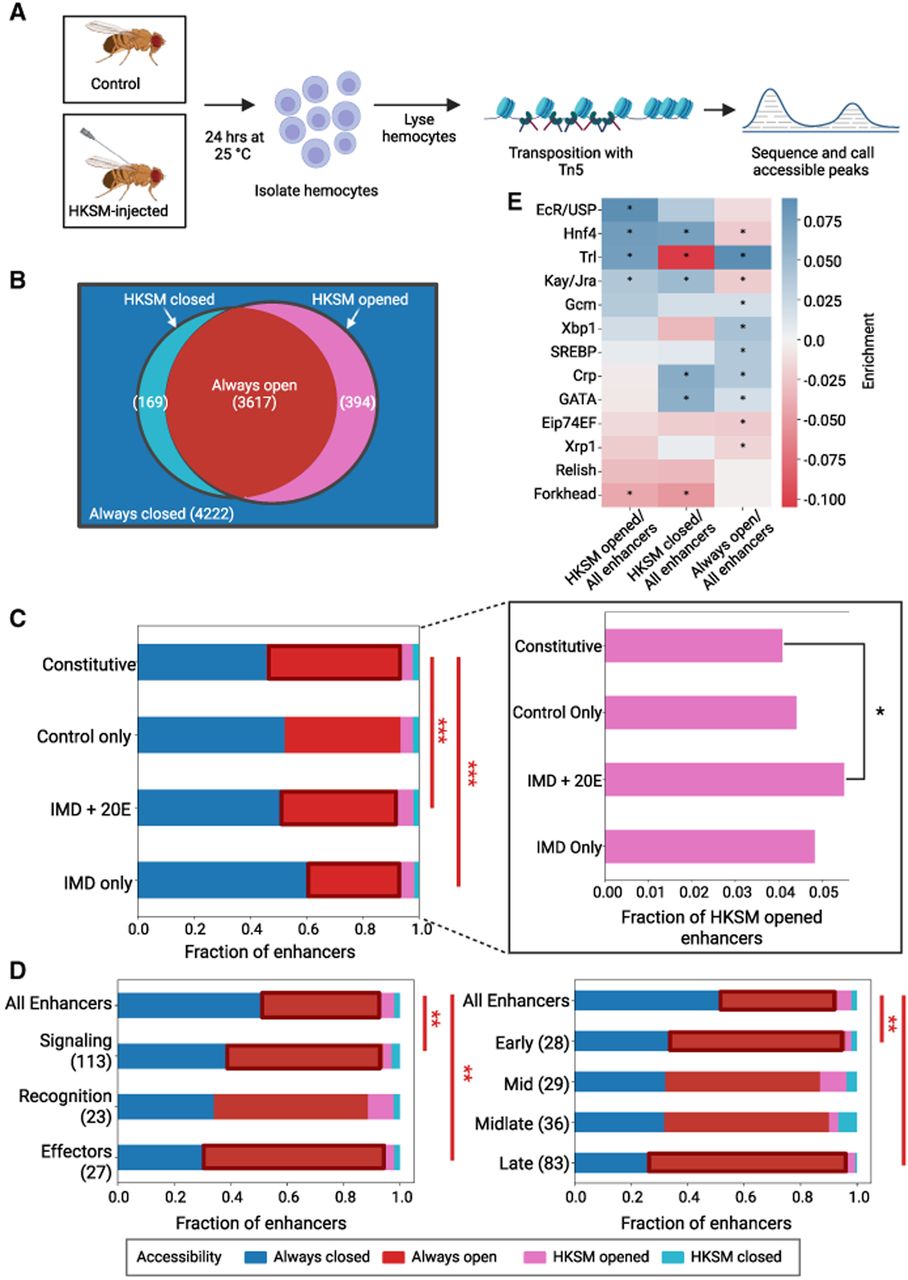
ATAC-seq reveals immune-inducible enhancers are made accessible by EcR/Usp, Hnf4, Trl, and Kay/Jra. (A) Diagram of ATAC-seq on immune-stimulated hemocytes. Flies are injected with HKSM and, along with age-matched controls, are incubated for 24 h at 25°C. Then flies are anesthetized; hemocytes are extracted via centrifugation before lysis and transposition. Tn5 was used to insert adaptors into accessible chromatin. These fragments are then isolated and sequenced to identify accessible peaks. (B) Venn diagram of accessibility groups of enhancers. Always-closed enhancers are in blue and are inaccessible in both the control and HKSM samples. The left circle is enhancers open in the control sample (Always-open and HKSM-closed), and the right circle is enhancers open in the HKSM sample (Always-open and HKSM-opened). The intersection has enhancers open in both. The number of enhancers in each group is listed in parentheses. (C) Fraction of enhancers in each accessibility group by activity class. Constitutively active enhancers are more likely to be always open than immune-responsive enhancers. (***) P < 0.005, z-test, Bonferroni multiple test correction. Inset of the same data for HKSM-opened enhancers, plotted separately for clarity. A greater proportion of IMD + 20E enhancers are HKSM-opened than are constitutive enhancers. (*) P < 0.1, two sample z-test. (D) Fraction of enhancers in accessibility groups grouped by broad immune roles (left) and time clusters (right). (**) P < 0.05, z-test, Bonferroni multiple test correction; (***) P < 0.005, z-test, Bonferroni multiple test correction. (E) Log odds ratio of TFBSs in enhancers by accessibility compared with all enhancers, for previously identified motifs. Positive enrichment values are in blue, and negative enrichment values are in red. (*) P < 0.05, Fisher's exact test.