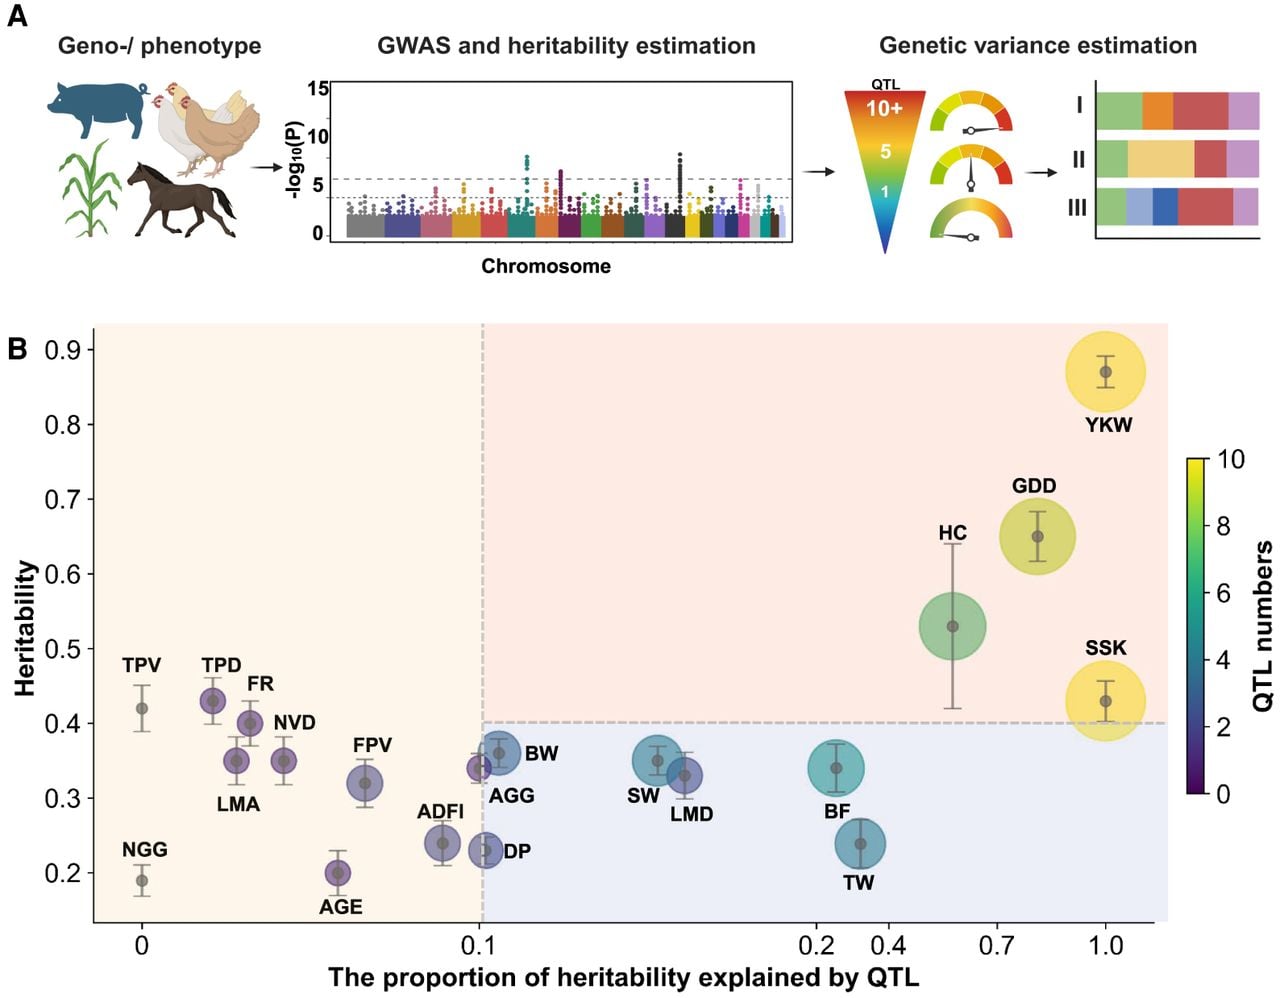
Evaluation of the genetic architecture. (A) Overview of the analytical framework. Phenotypic and genomic data from four species (pig, chicken, horse, and maize) were used to estimate heritability and genetic variance components, and a genome-wide association study (GWAS) was conducted to identify significant quantitative trait loci (QTLs). (B) Relationship between trait heritability and proportion of heritability explained by QTLs. Each circle represents a trait, and the color intensity and circle radius correspond to the number of QTLs associated with the trait. Based on heritability and the proportion of heritability explained by QTLs, traits were categorized into three categories: (I) traits with high heritability and a high proportion of heritability explained by QTLs (red; n = 4); (II) traits with moderate-to-low heritability and a high proportion of heritability explained by QTLs (blue; n = 7); and (III) traits with low heritability and a low or negligible proportion of heritability explained by QTLs (yellow; n = 9).