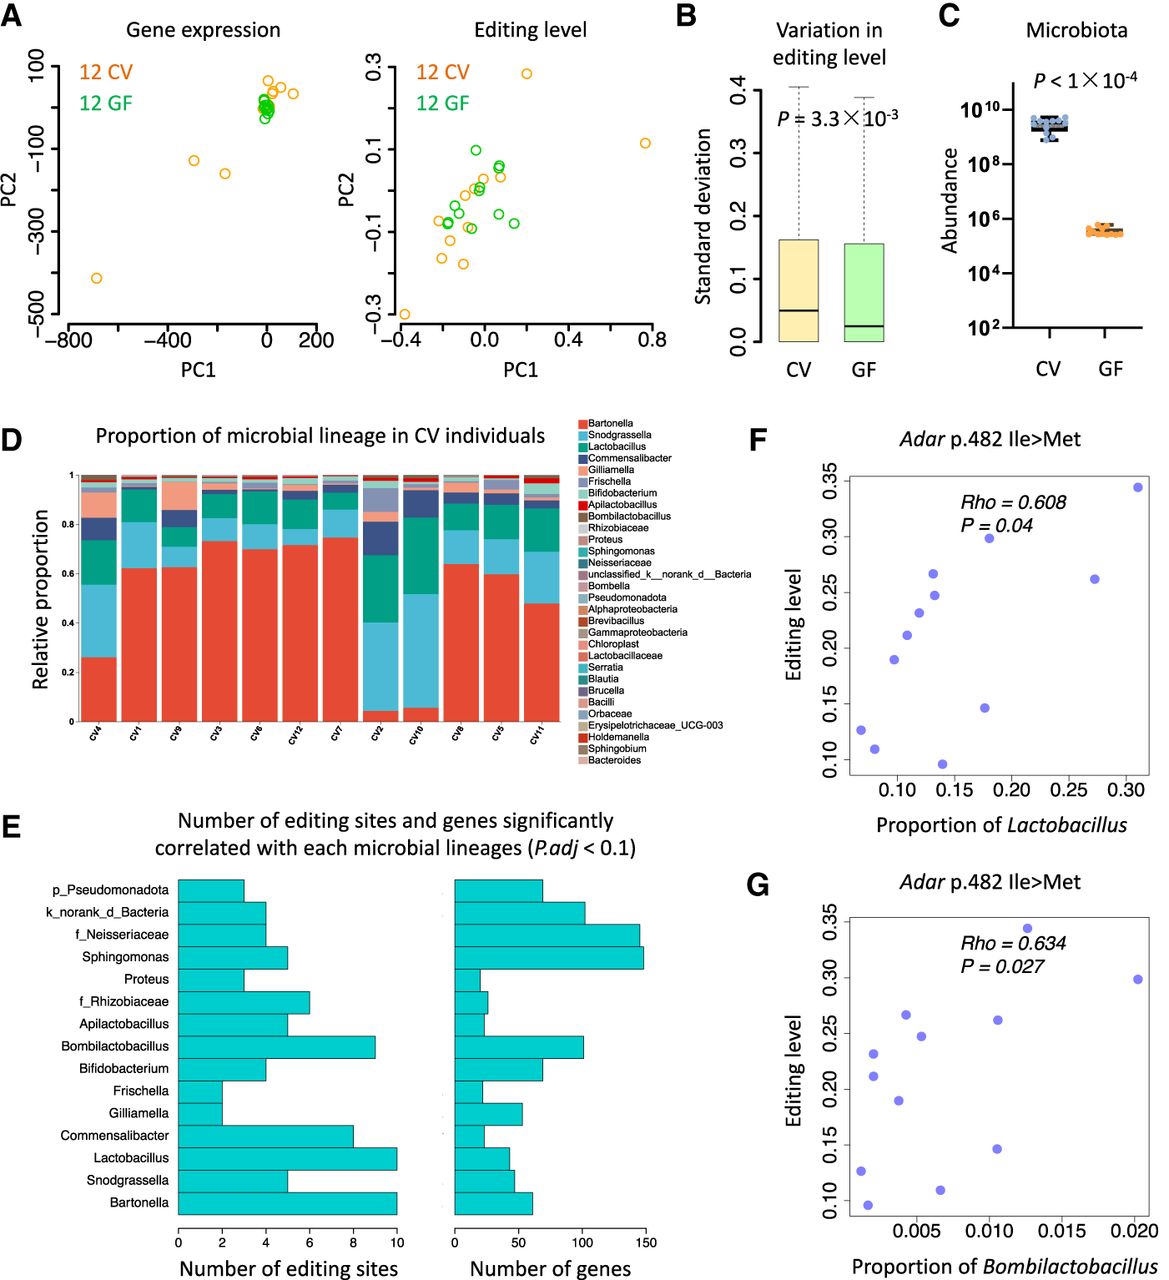
Intragroup variations of gut microbiota of CV and GF bees. (A) Principal component analyses of gene expression (RPKM) and editing levels of CV and GF samples. CV samples are in orange, and GF samples are in green. (B) Boxplot comparing the standard deviation of editing level in CV and GF. P-value was calculated by Wilcoxon rank-sum test. (C) Distribution of total microbiota abundance of 12 CV and 12 GF samples. The y-axis is log10-transformed. (D) Microbial lineage composition in each of the 12 CV samples. (E) Barplots showing the numbers of editing sites and genes with significant correlation (adjusted P < 0.1) with the relative abundance of each microbial lineage. (F,G) Spearman's correlation between the editing level of the Adar p.482 Ile > Met site and the relative proportion of Lactobacillus (F) and Bombilactobacillus (G) in each CV bee.