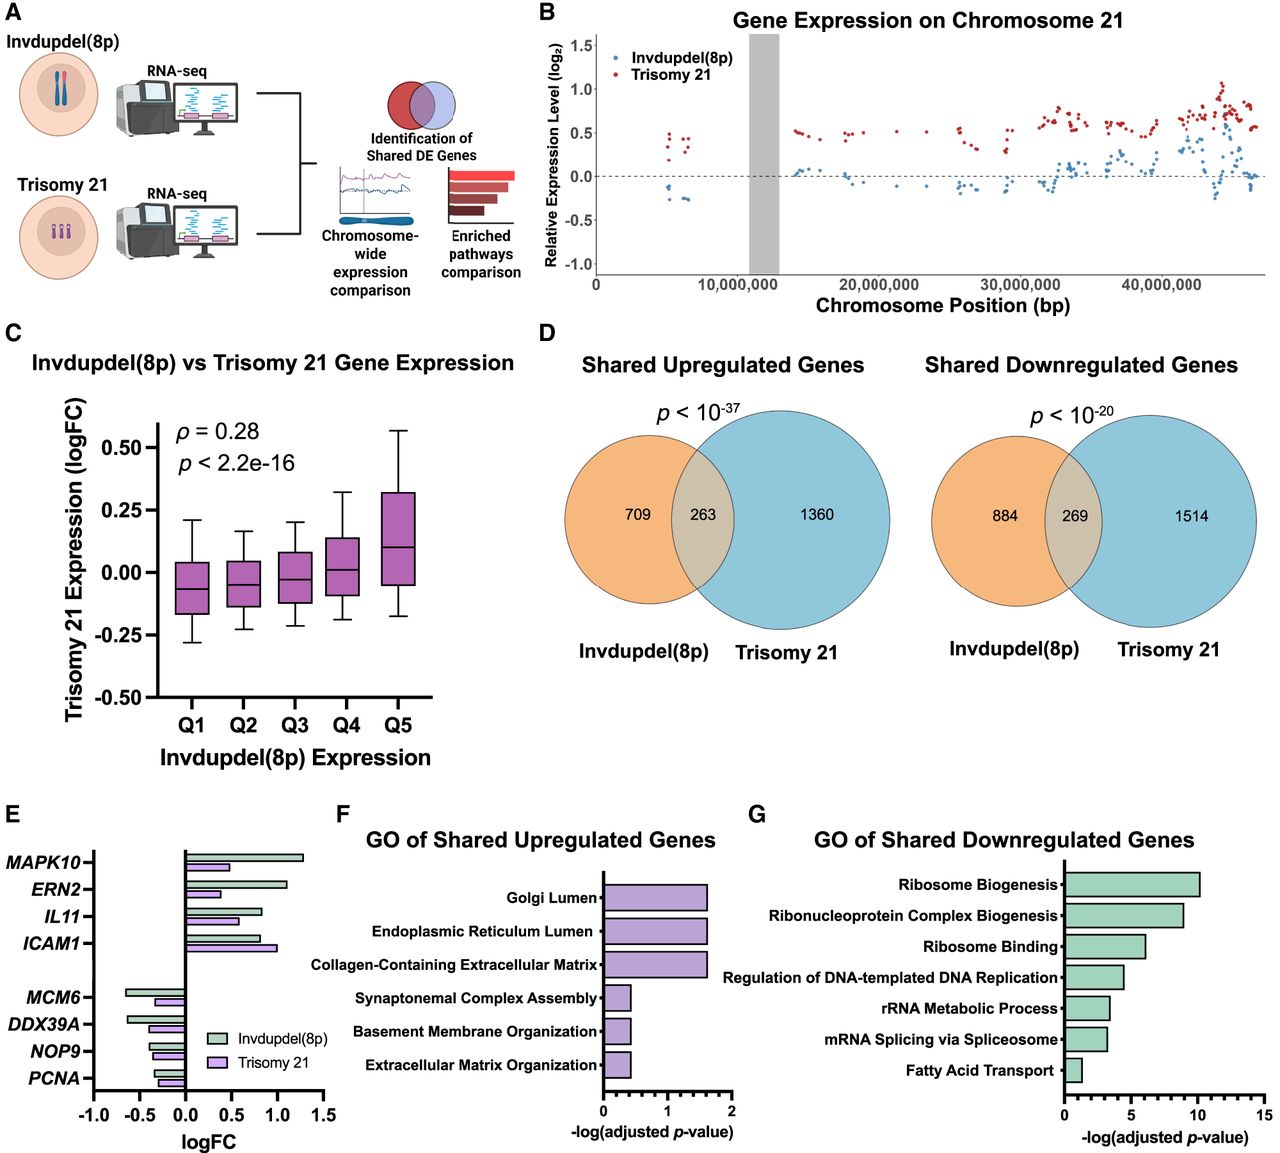
Identification of shared transcriptional changes between invdupdel(8p) and Trisomy 21. (A) Schematic summarizing the comparative analysis and characterization of gene expression data from invdupdel(8p) and Trisomy 21 RNA-seq data sets. (B) Diagram comparing relative gene expression versus chromosome position along Chromosome 21. (C) The x-axis displays quantile grouping of genes based on logFC of invdupdel(8p) analysis. The y-axis displays the quantile grouping of genes based on the logFC of the Trisomy 21 analysis. Spearman's correlation coefficient and P-value are displayed. (D) Venn diagrams delineating shared upregulated (left) and shared downregulated (right) DE genes between the invdupdel(8p) and Trisomy 21 data sets. A complete list of genes is included in Supplemental Table S4. (E) Example genes that are differentially expressed in both invdupdel(8p) and Trisomy 21 iPS cells. (F) Gene Ontology of shared upregulated genes between the invdupdel(8p) and Trisomy 21 data sets. Complete results are included in Supplemental Table S5. (G) Gene Ontology of shared downregulated genes between the invdupdel(8p) and Trisomy 21 data sets. Complete results are included in Supplemental Table S6.