Figure 4.
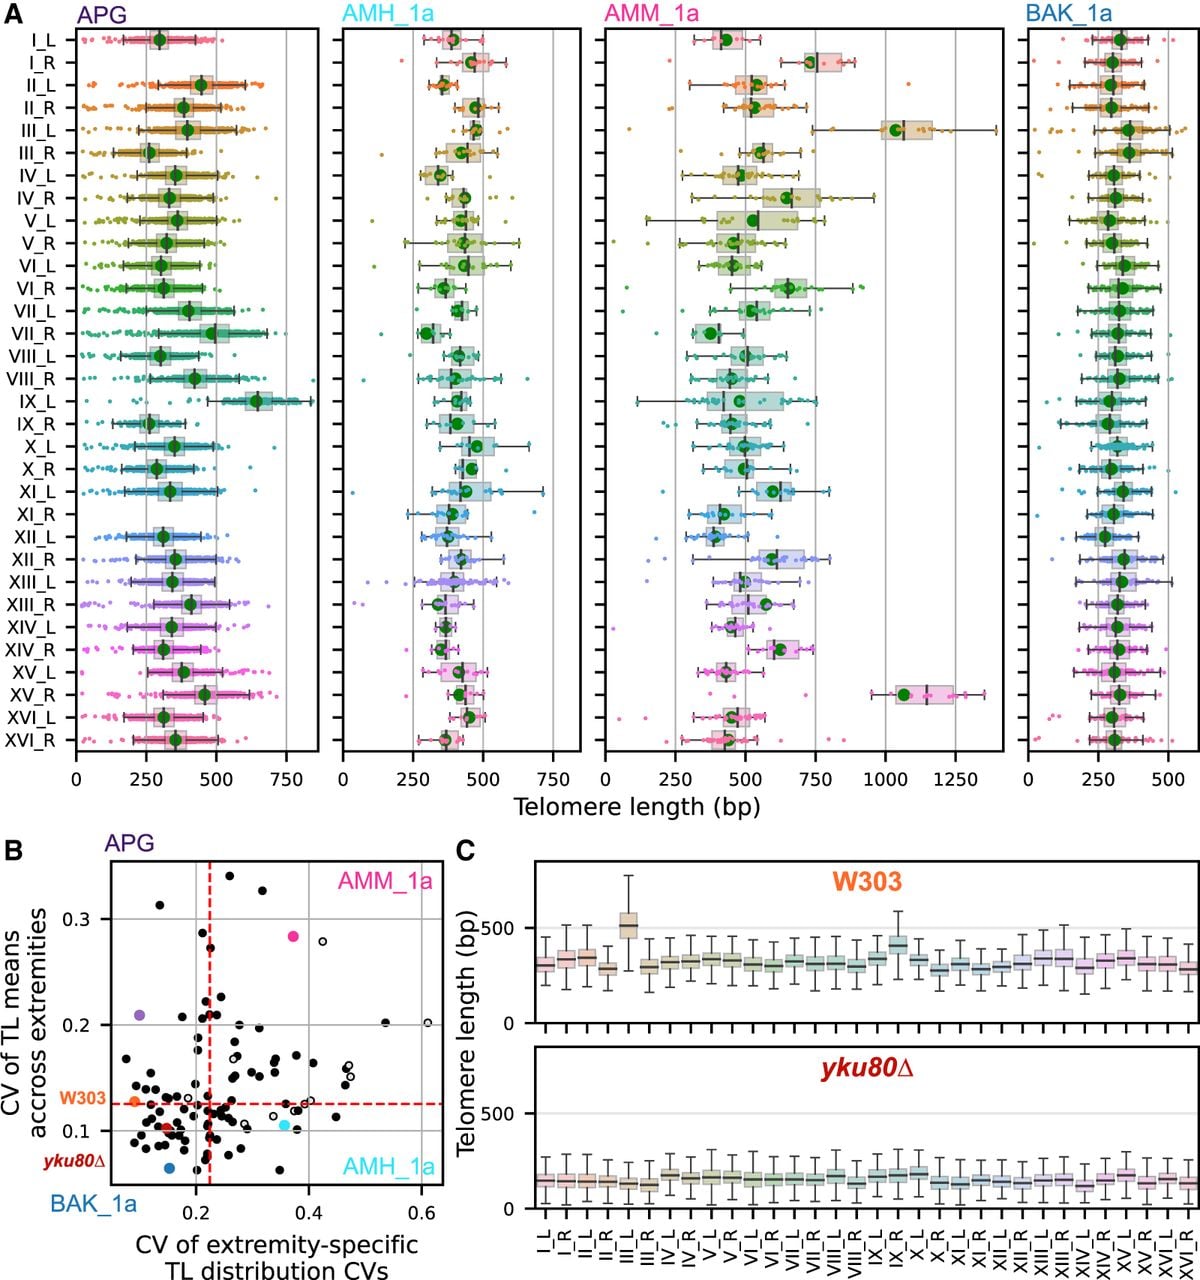
Diversity of extremity-specific TL in natural S. cerevisiae strains. (A) TL distributions at every chromosome extremity for four selected strains, represented as boxplots with individual read TLs plotted as dots. (B) 2D plot displaying the CVs of extremity-specific TL means and the CVs of extremity-specific TL distributions CVs. Each strain is represented as a dot, and this 2D space is divided vertically and horizontally into two equally sized areas. Open dots indicate strains for which the sample size of the reads was insufficient for confident inference. The four strains shown in A as well as W303 and its yku80Δ derivative are labeled in color. (C) TL distributions at every chromosome extremity for W303 and its derived yku80Δ mutant.