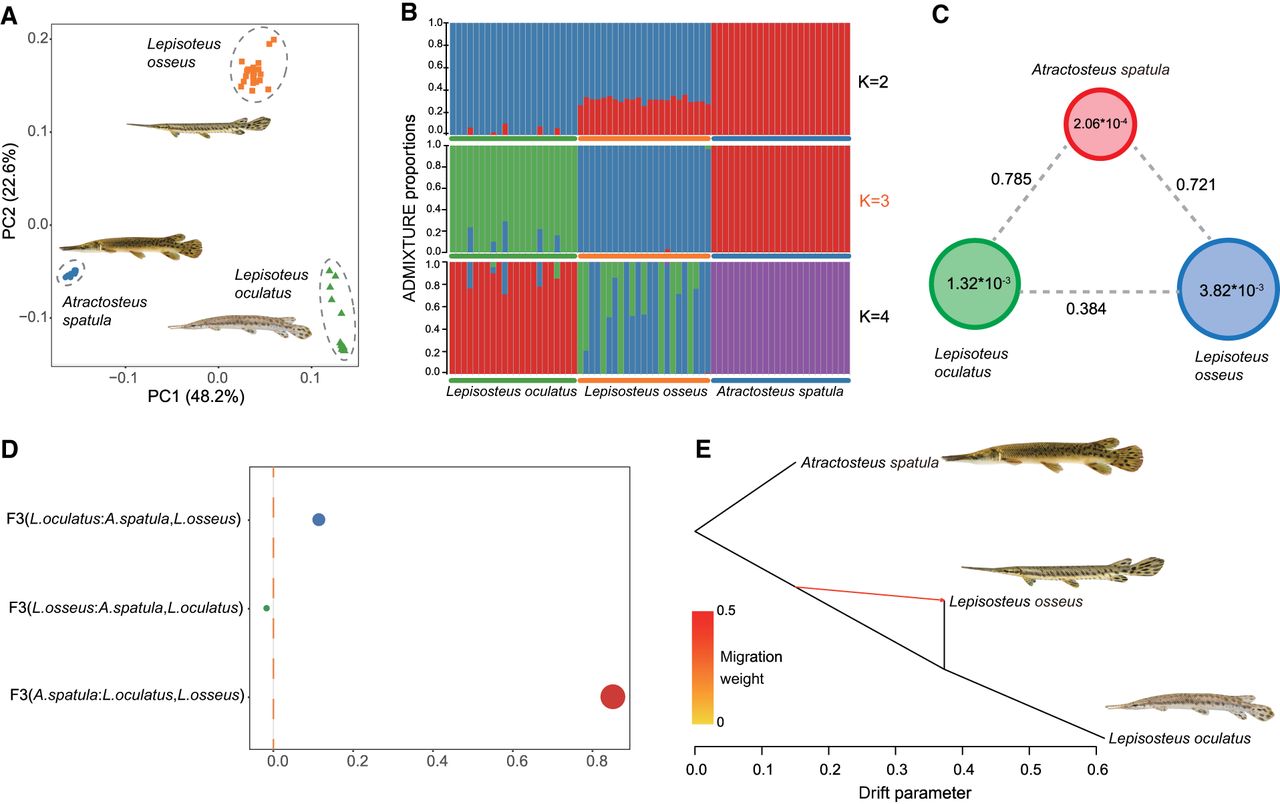
Figure 4.
Population structure and ancient introgression of living gar genera. (A) PCA analysis of population data from three gar species. (B) ADMIXTURE results with K values ranging from 2–4 with three (K = 3) found as the optimal number of populations. (C) Average FST and π values among the three gar species. (D) F3 statistics for L. oculatus, L. osseus, and A. spatula. (E) Treemix trees with one migration events (m = 1).