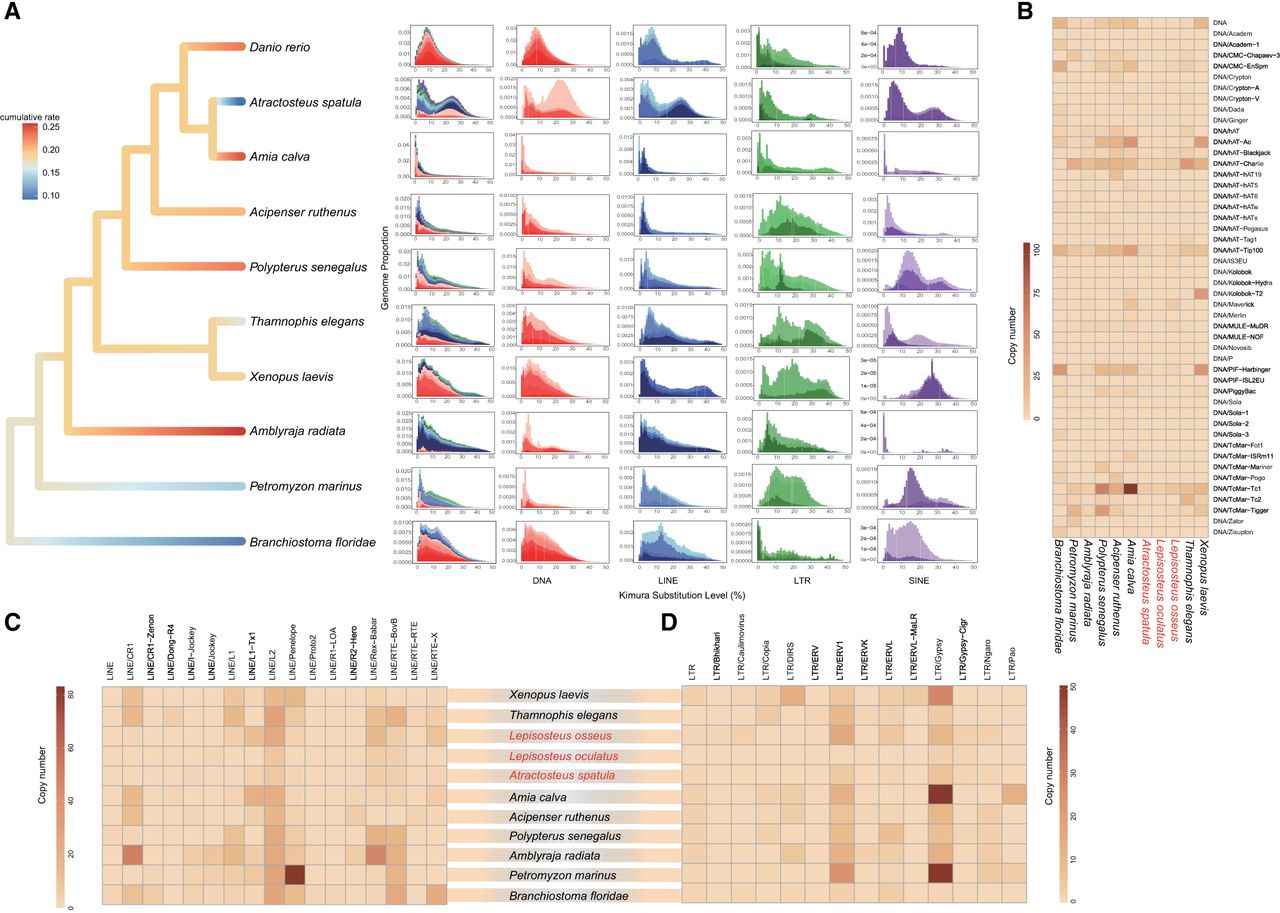
Figure 3.
Repeat sequences evolutionary rate of gars compared with diverse chordate lineages. (A) Phylogenetic branches are colored according to the evolutionary rate of recently accumulated transposable elements (TEs) with <10% Kimura divergence from consensus TEs across diverse species. The plot on the right shows the distribution of transposable elements based on Kimura distance analysis in these species. Kimura divergence of 25 marks the major ancient peak in A. spatula and is used for comparison. (B–D) Comparison of DNA/LINE/LTR transposable element copy numbers with <10% Kimura divergence from consensus sequences across diverse species.