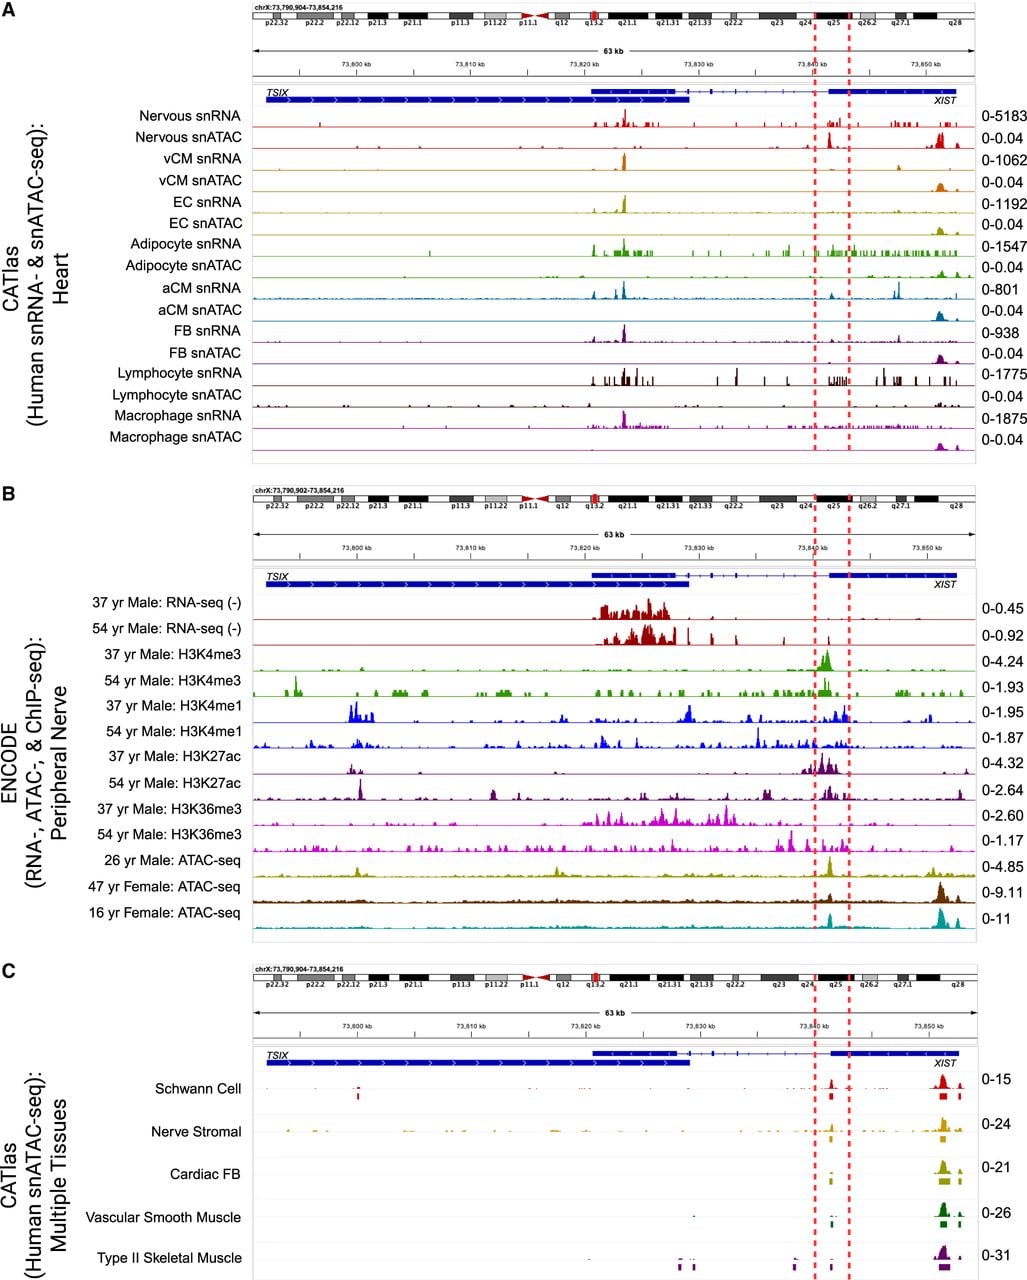
Assessment of ATAC-, RNA-, and ChIP-seq read coverages over the XIST locus. (A) snRNA/ATAC-seq tracks from CATlas heart data set. (B) RNA-seq (±strands) and H3K4me3, H3K4me1, H3K27ac, and H3K36me3 ChIP-seq from two human male tibial nerve samples and ATAC-seq tracks from one human male and two female sciatic nerve samples in the ENCODE database. (C) snATAC-seq tracks from CATlas multitissue data set. (A–C) All plots show the region at Chr X: 73,790,905–73,854,216 from the hg38 reference genome. The 3′ region of XIST exon 1 is enclosed by two red dashed lines. TSIX gene location spanning Chr X: 73,792,205–73,829,231 on the + strand is shown as a blue bar, indicating the RNA-seq reads were from XIST but not TSIX. For each track, cell types and/or sequencing modality are shown on the left, and the data range is shown in the right. Additional data for the tibial and sciatic nerve samples are in Supplemental Figure S7.