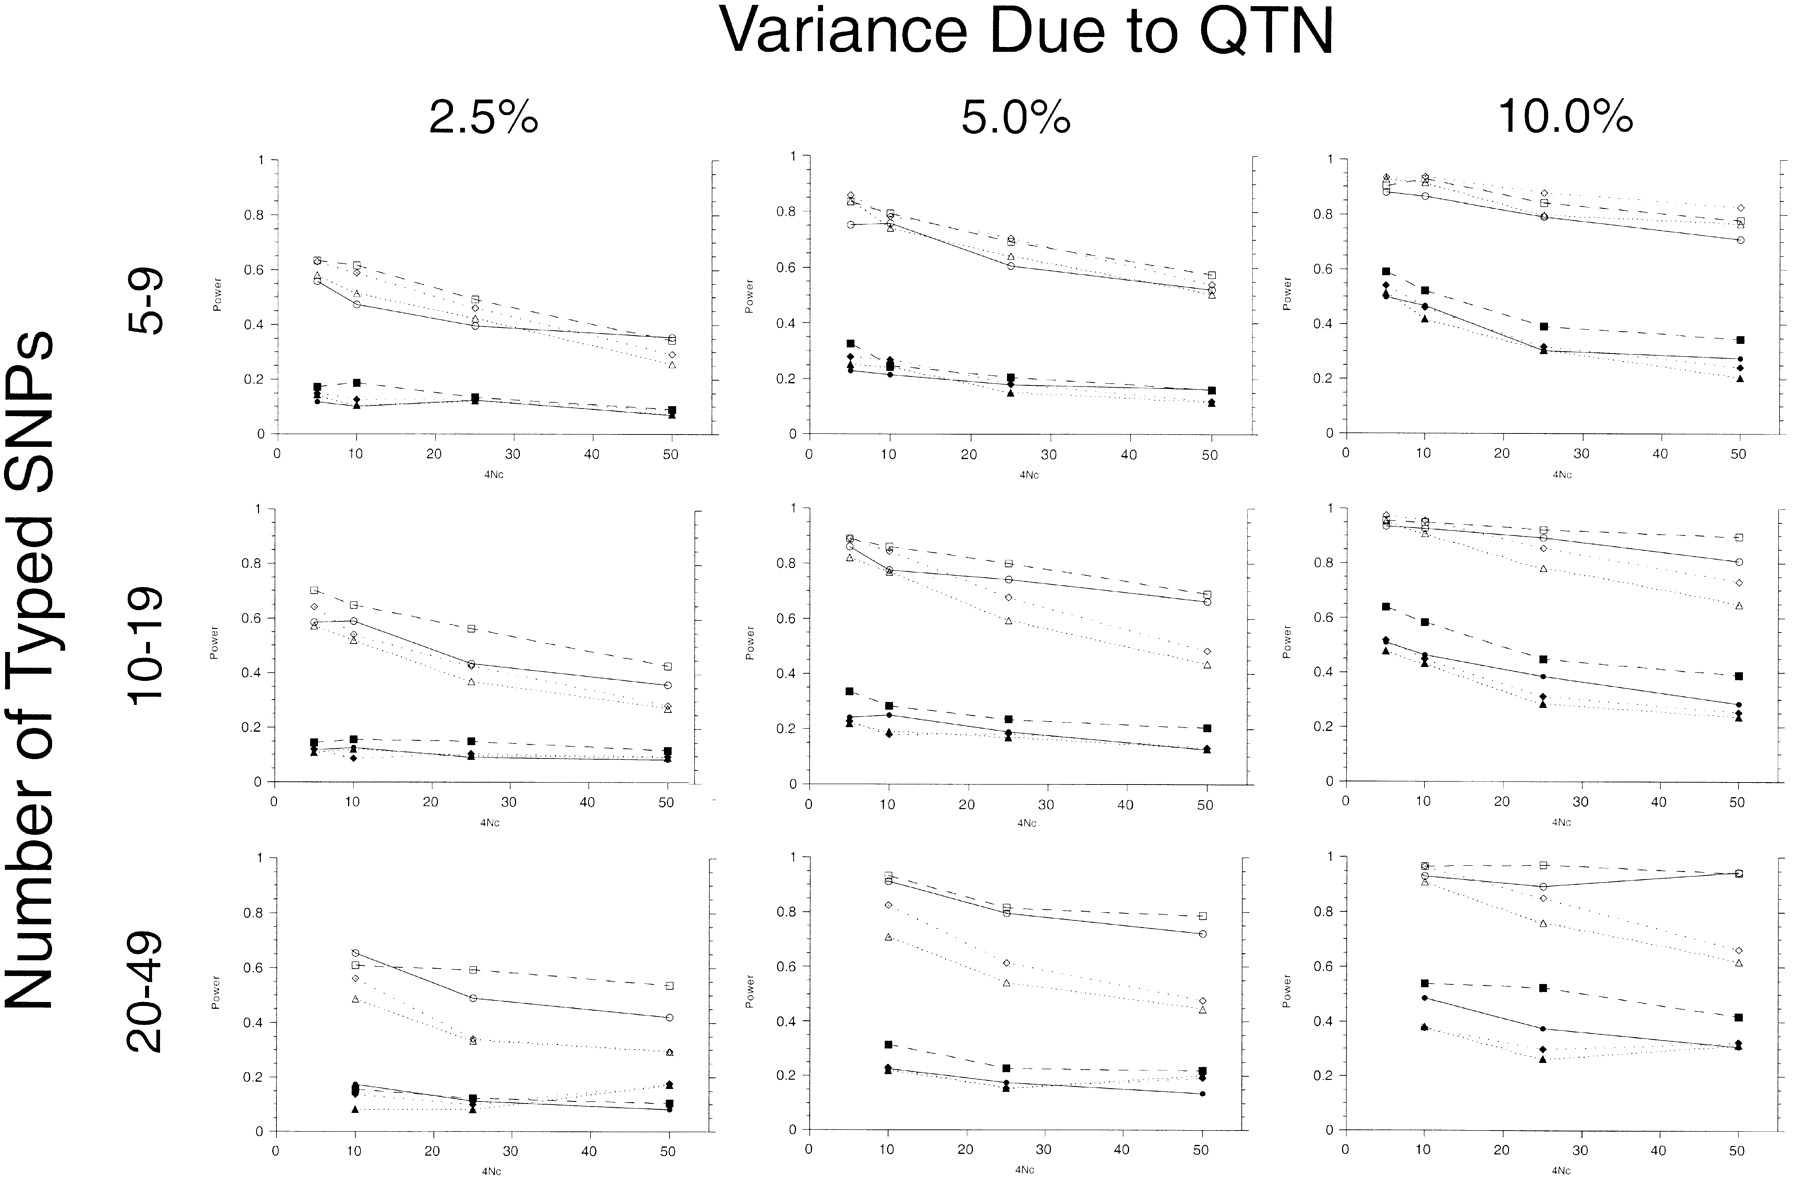
The power of detecting an association between SNPs and variation in a quantitative trait for four different statistics designed to detect such associations. The four statistic are represented by squares for HMP, diamonds for HHA, triangles for HHP, and circles for DMP. Solid symbols are for 100 individuals examined; open symbols are for 500 individuals examined. Power was estimated for QTNs accounting for three different percentages of the total phenotypic variation and three different ranges of the number of typed SNPs in the study. In each cell the power is plotted as a function of the total size of the candidate gene region scanned for an association expressed in units of 4Nc. Power estimates for the case of 20–49 typed SNPs when 4Nc is equal to 5 are omitted, because of a small number of replicate measures of power for this combination of parameter values.