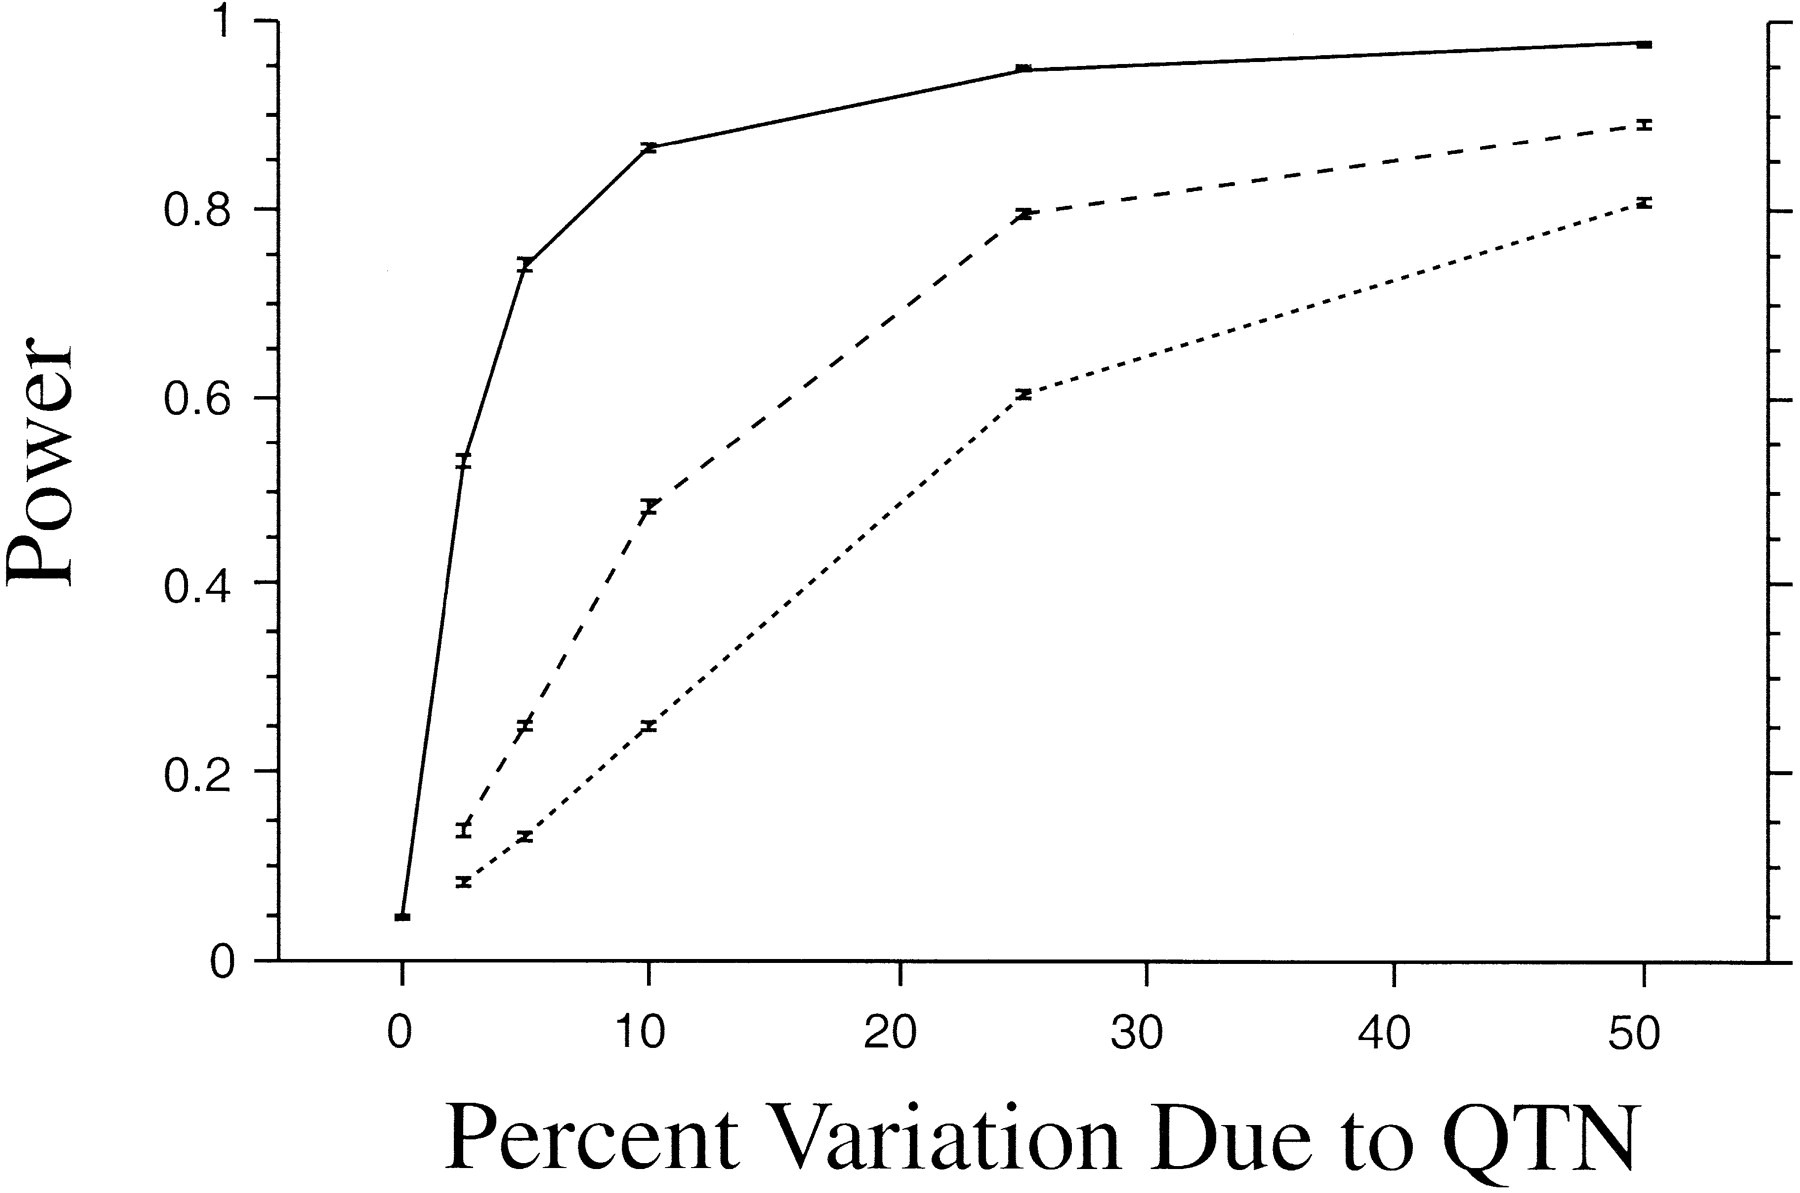
Figure 1.
The power of the HMP as a function of the simulated percentage of variation attributable to the QTN. Dotted, dashed, and solid lines are for experiment sizes of 50, 100, and 500 individuals, respectively. Standard errors are over replicate simulations. Each point is the average power over 12 parameter combinations of the number of segregating sites {10, 25, 50} and 4Nc {5, 10, 25, 50}.