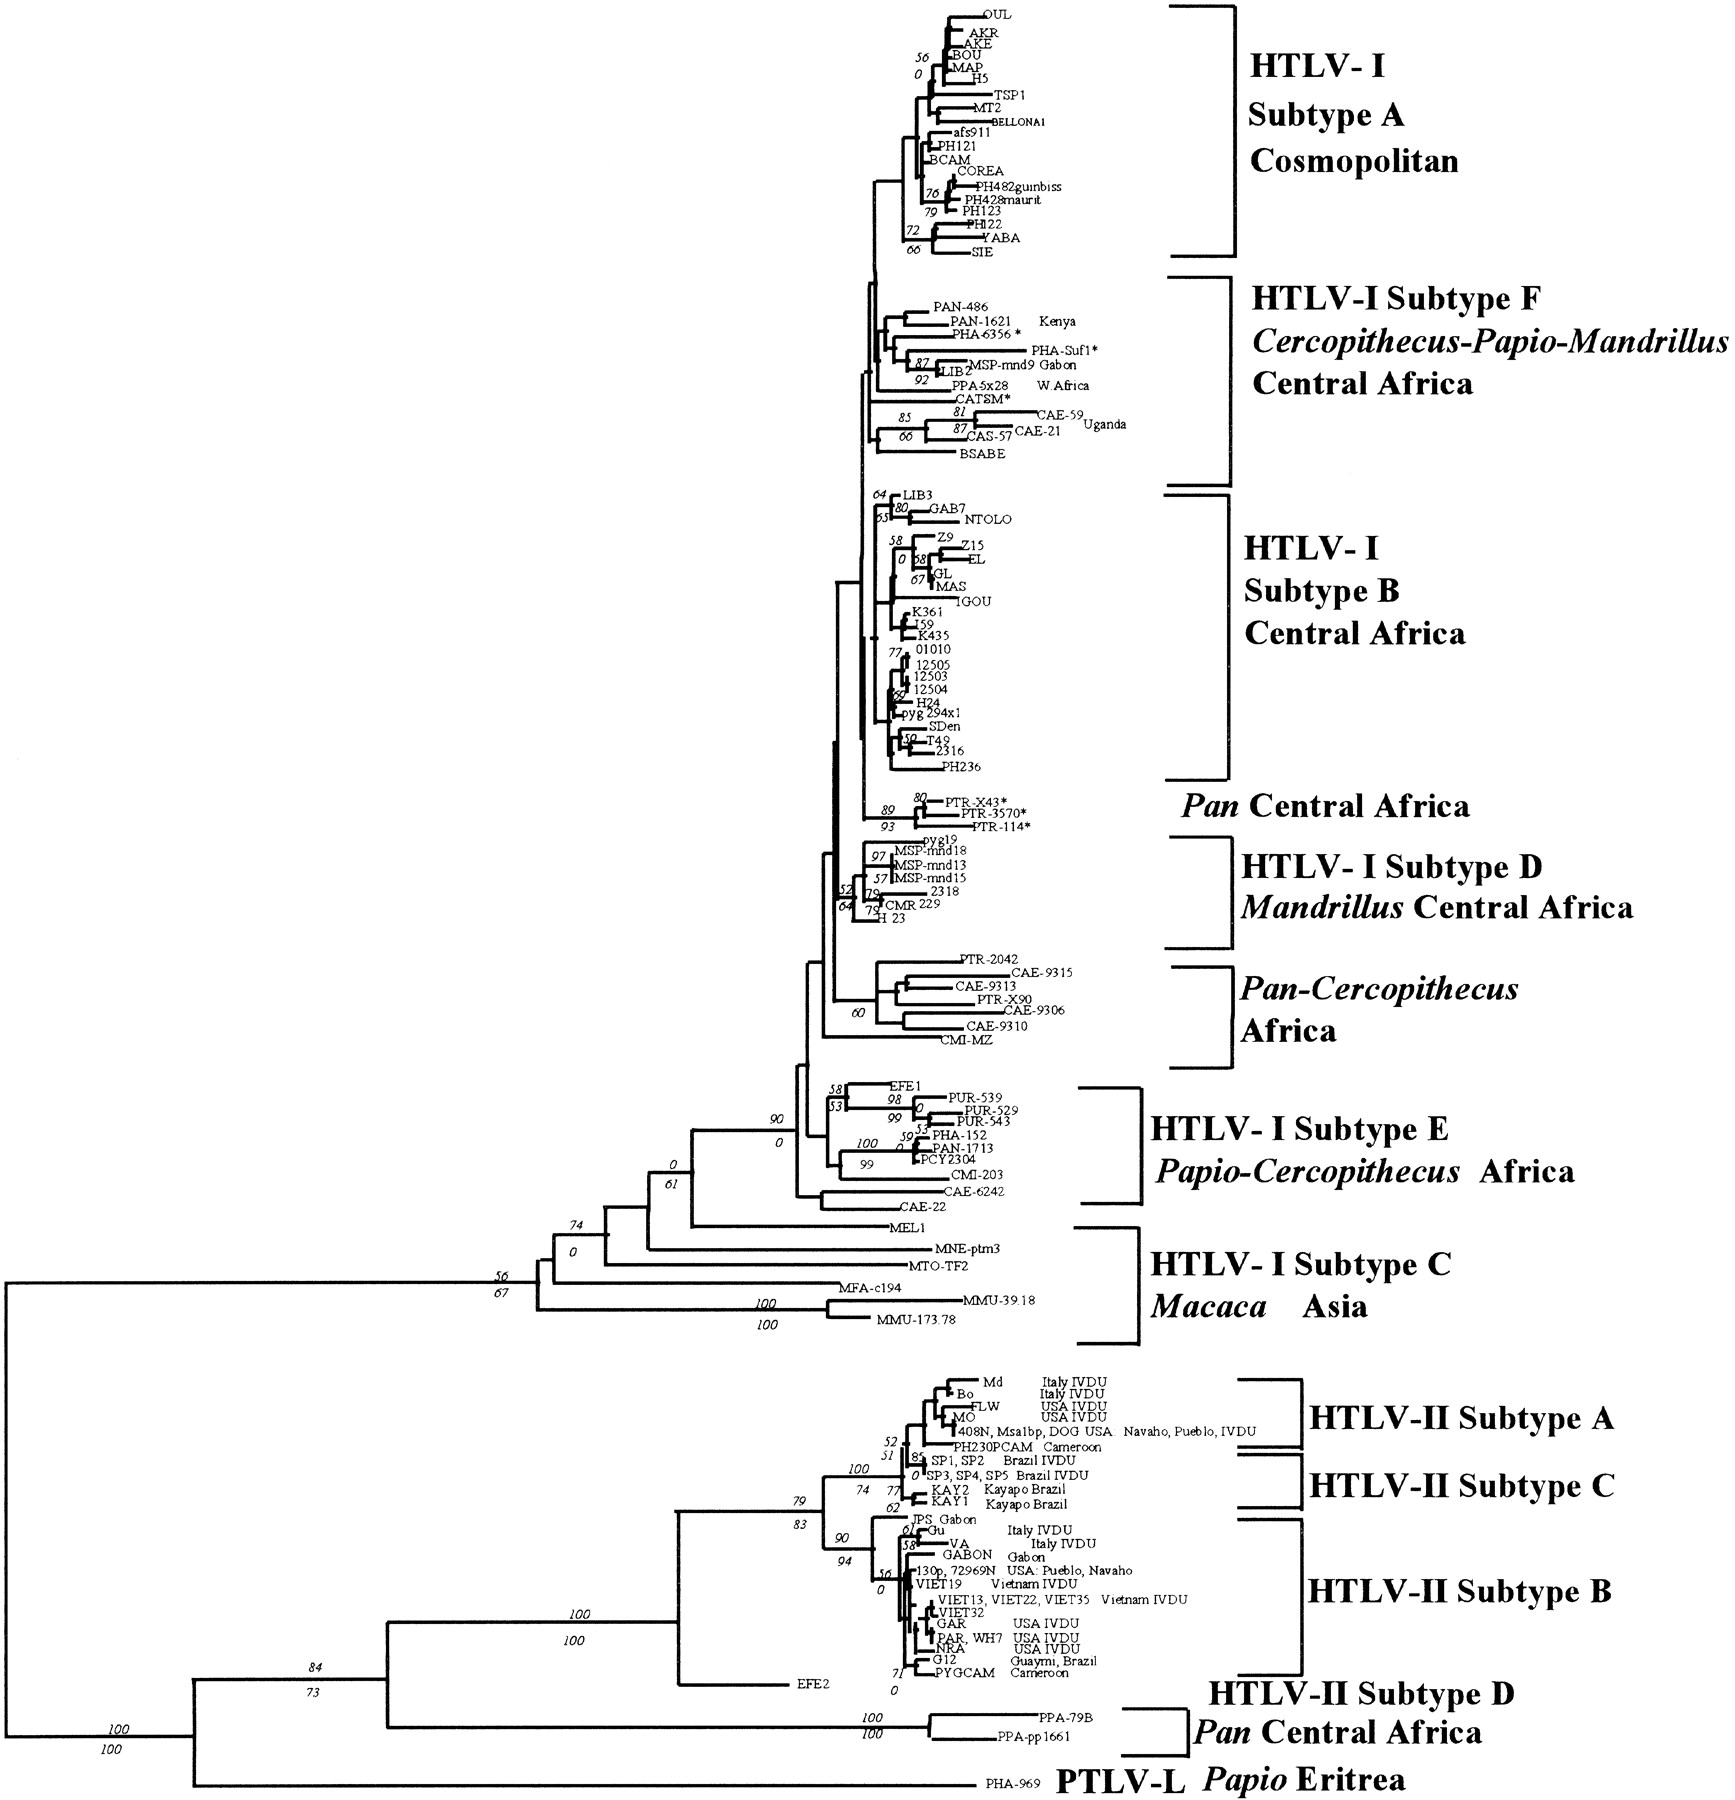
Phylogenetic analysis of 452 bp of the env gene across 113 representative HTLV/STLV. Shown is the 50% majority rule consensus of six trees derived from ME estimated by NJ. A 50% majority rule consensus of 5000 trees (length = 824; C.I. = 0.481) and a ML tree (ln likelihood = −4997.59; 21909 trees examined) corroborate the topology depicted. Numbers in italics denote bootstrap proportions in support of adjacent node (NJ/MP). Both NJ and MP trees were reconstructed using PAUP* (by permission of D. Swofford, Smithsonian Institution, Washington, DC). Unrooted NJ trees were based on the Kimura two-parameter model of substitution (Kimura 1980); negative branch lengths allowed with tree-bisection-reconnection swapping algorithm. Conditions for MP heuristic search used unordered characters of equal weight, gaps were treated as a fifth base, and trees were rooted by the midpoint method. ML tree reconstructed by PHYLIP35 (Felsenstein 1993) subroutine DNAML. Asterisks (*) denote simian virus strains of unknown geographic origin. Accession numbers for all 113 strains used in this analysis are listed athttp://rex.nci.nih.gov/RESEARCH/basic/lgd/front_page.htm.