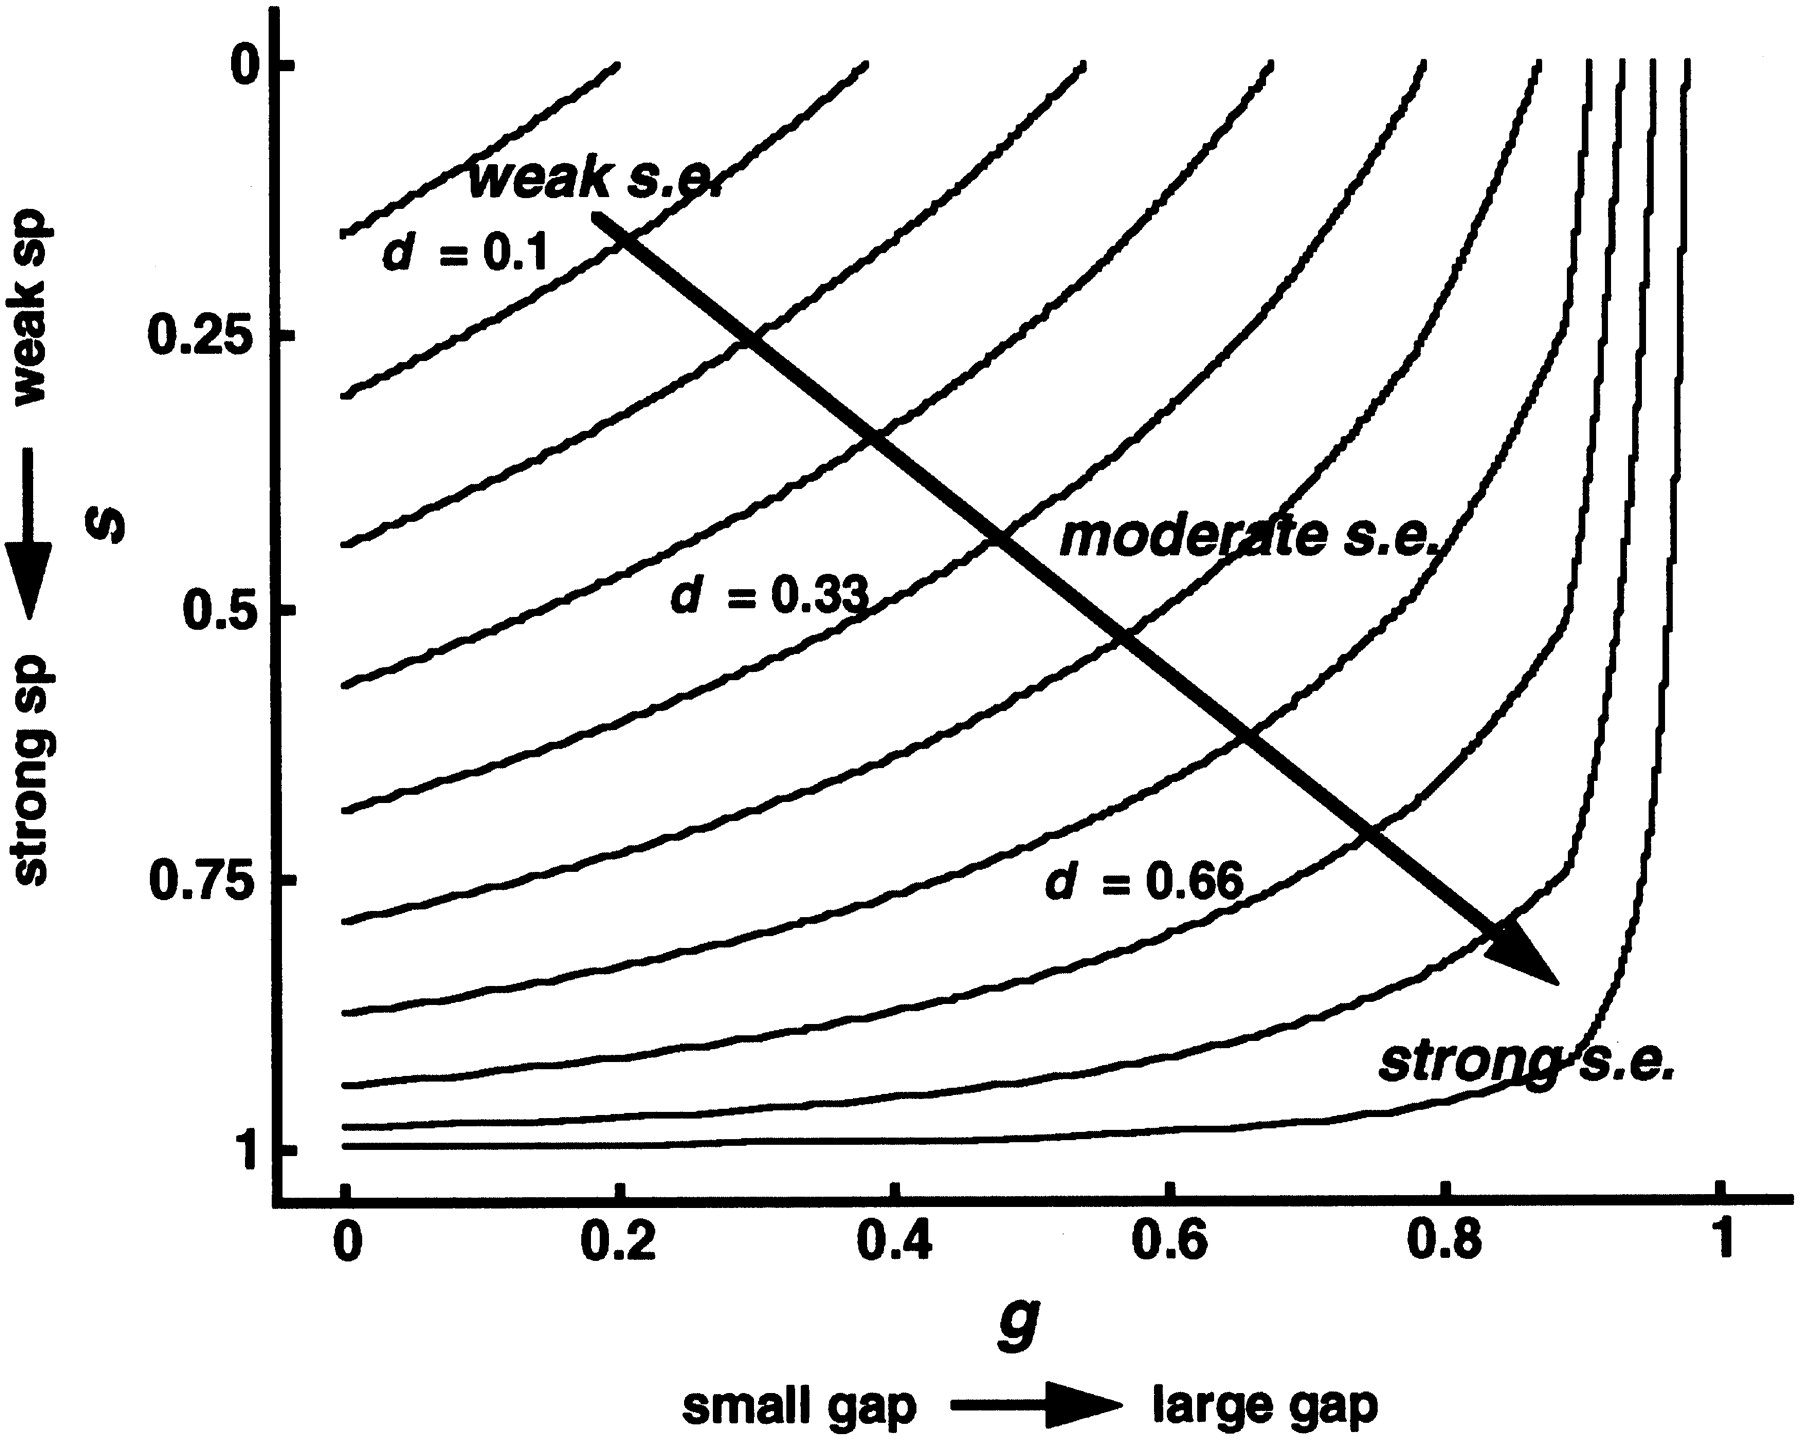
Figure 8.
Decision function for selective expression of overall confidence. The decision function [d(g,s), equation 15] is plotted as constant d contours in the space of (g,s) coordinates, each ⩾0 and ≤1. (g,s) Respective linear transformations of gap and baseline adjusted log10(sp) between the weak thresholds and strong limits (equations 13 and 14). Overall confidence of a selective expression is assessed by the value of the decision function, weak being associated with d near 0 and strong associated with d near 1. Typically, we assign overall confidences as weak when 0 ≤ d < 0.33, moderate when 0.33 ≤ d < 0.66, and strong when 0.66 ≤ d ≤1.