Figure 1.
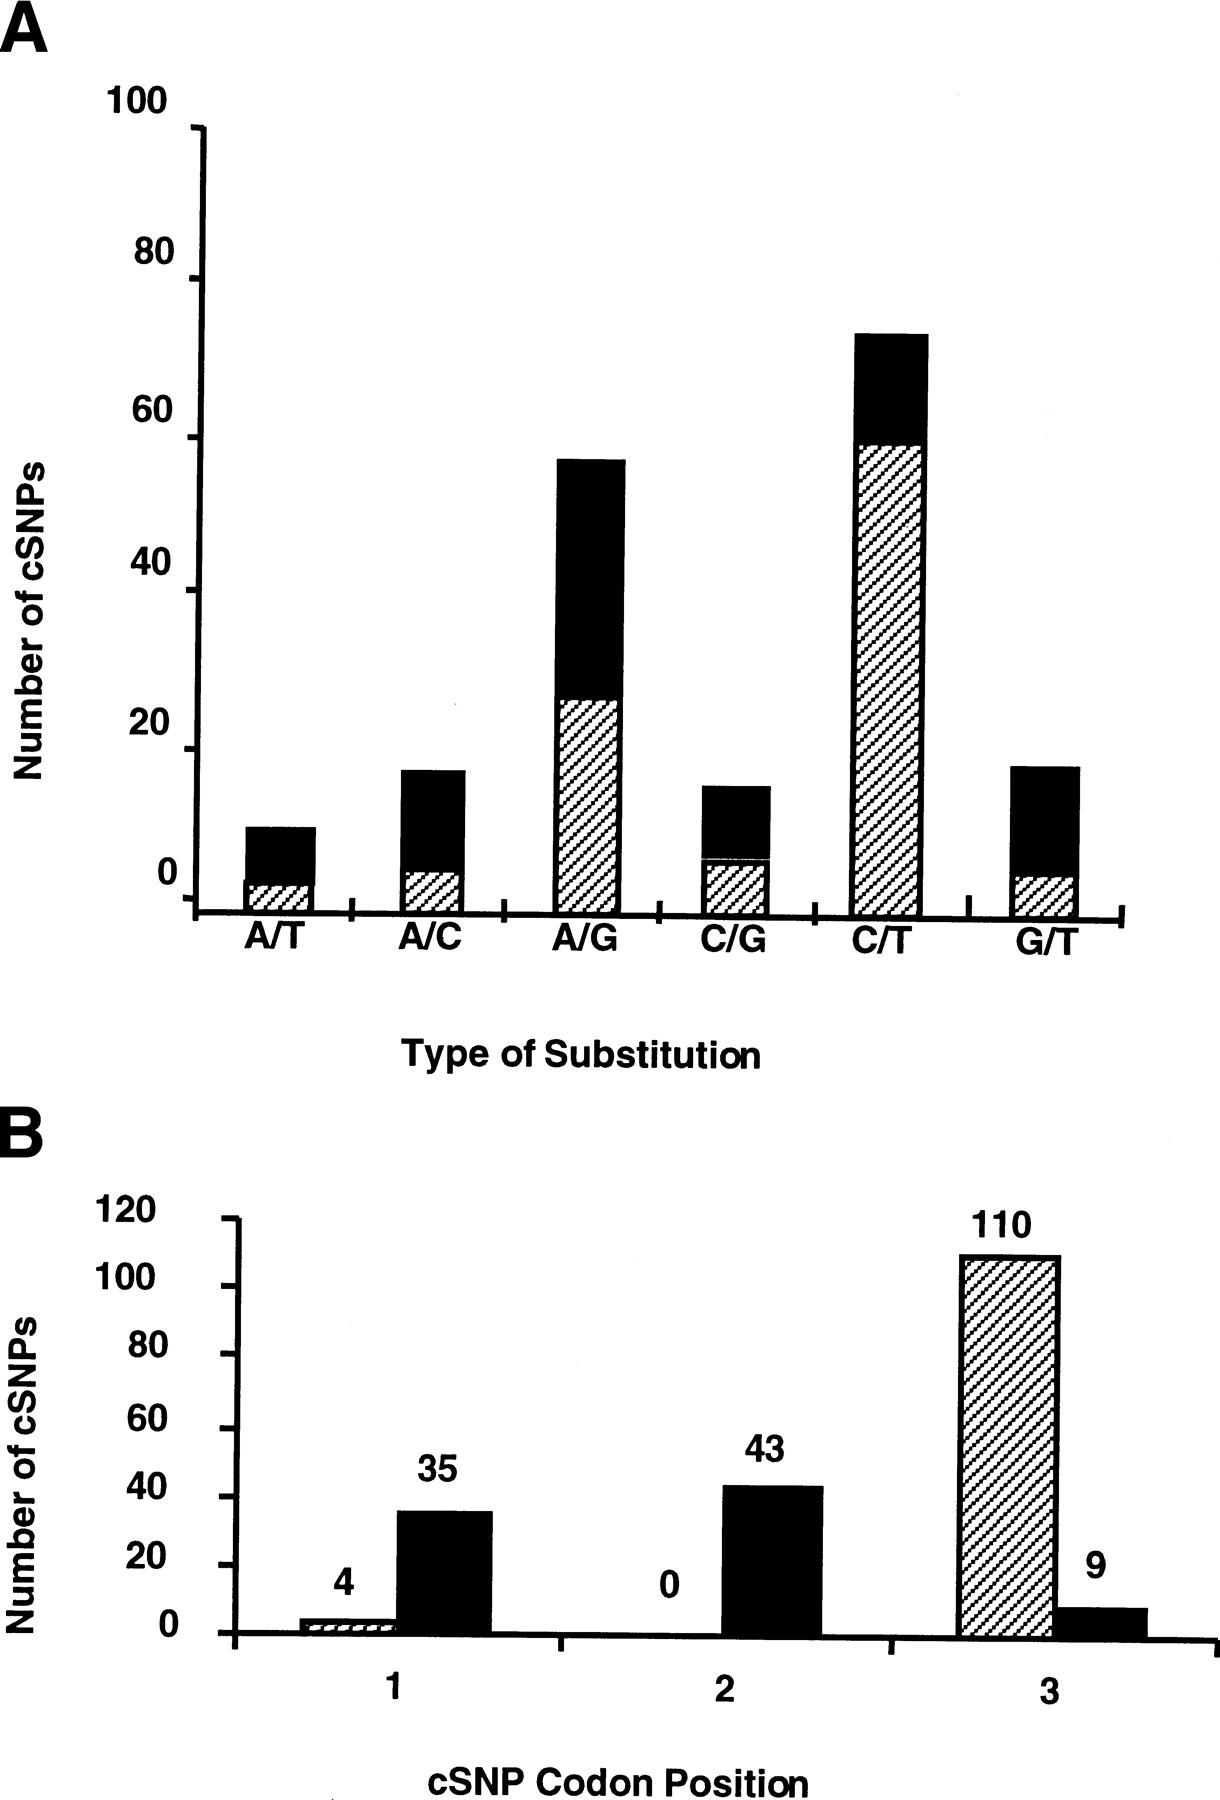
Distribution of candidate cSNPs by type of nucleotide substitution (A) and codon position (B), for synonymous (hatched bars) and nonsynonymous (solid bars) amino acid substitutions.
Distribution of candidate cSNPs by type of nucleotide substitution (A) and codon position (B), for synonymous (hatched bars) and nonsynonymous (solid bars) amino acid substitutions.