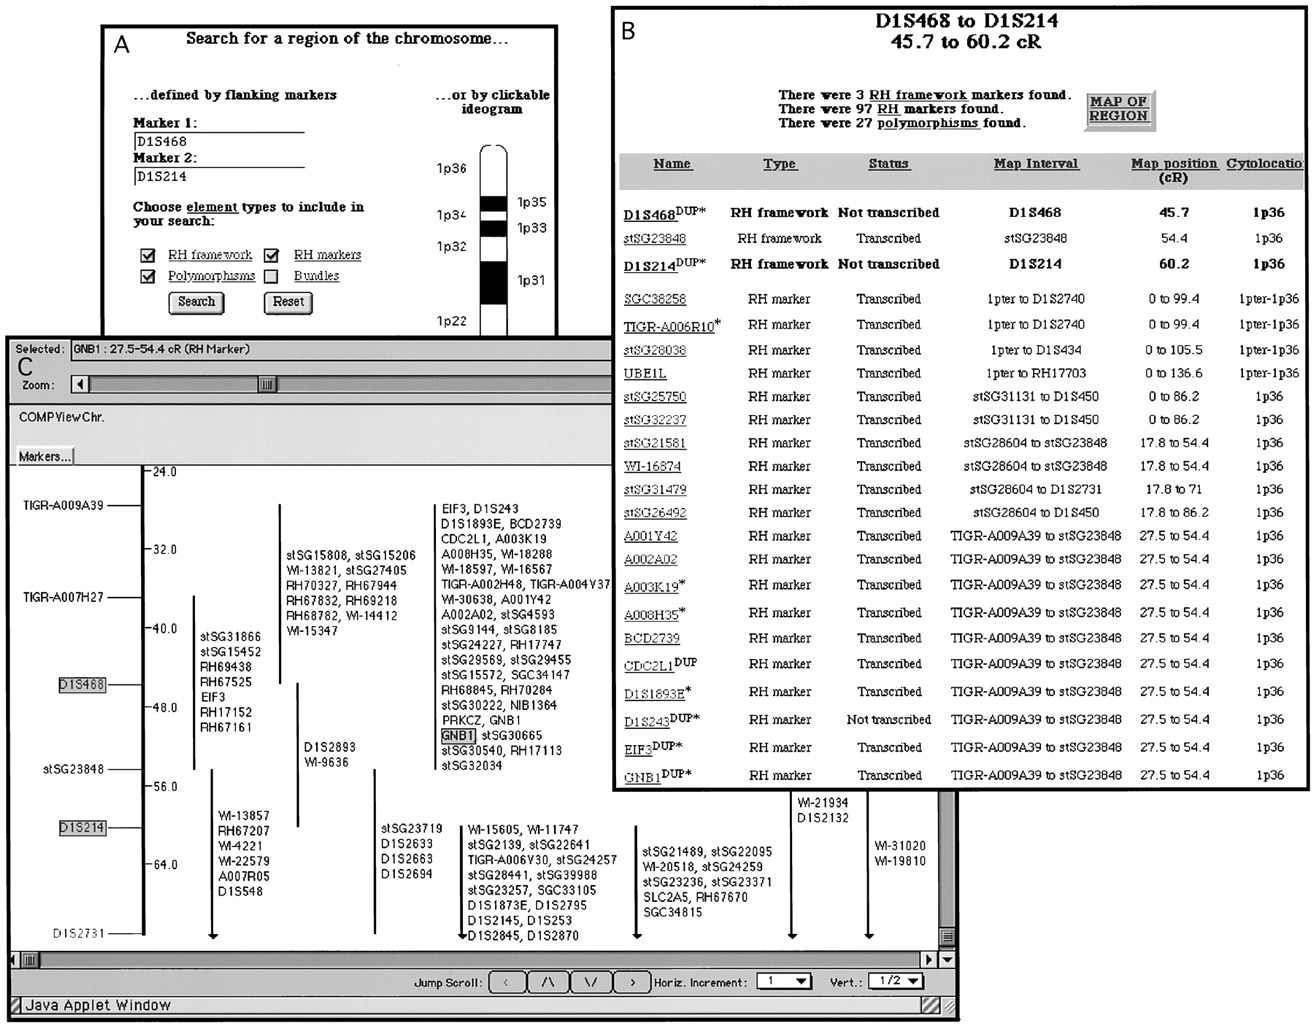
CompView Web interface examples. (A) Input screen to search for a region of the chromosome. Regions can be defined by two flanking markers (left), by clicking on a cytogenetic band from a chromosome ideogram (right), or by selecting one or a range of cytogenetic bands (not shown). A query input for the region between D1S468 and D1S214 is displayed. (B) Tabular return for the query D1S468 to D1S214 fromA. The marker type, transcriptional status, RH interval, RH map position, and cytolocation are shown for each marker, with a hyperlink to more complete information provided for each marker. Attop is shown the total number of each type of marker found. Clicking on the “map of region” button at top rightyields C. (C) Graphical return of the queryD1S468 to D1S214 viewed with Mapview. In this example, only the RH framework (left) and a portion of the RH markers' tier (right) are visible. CentiRay distances from 1pter are shown at right of the framework. Intervaled RH markers are preceded with a vertical line indicating their 1000:1 likelihood positions relative to the RH framework. The markers used for querying are highlighted on the framework, as is the RH marker forGNB1; clicking on GNB1 yields the marker record shown in Fig. 4.