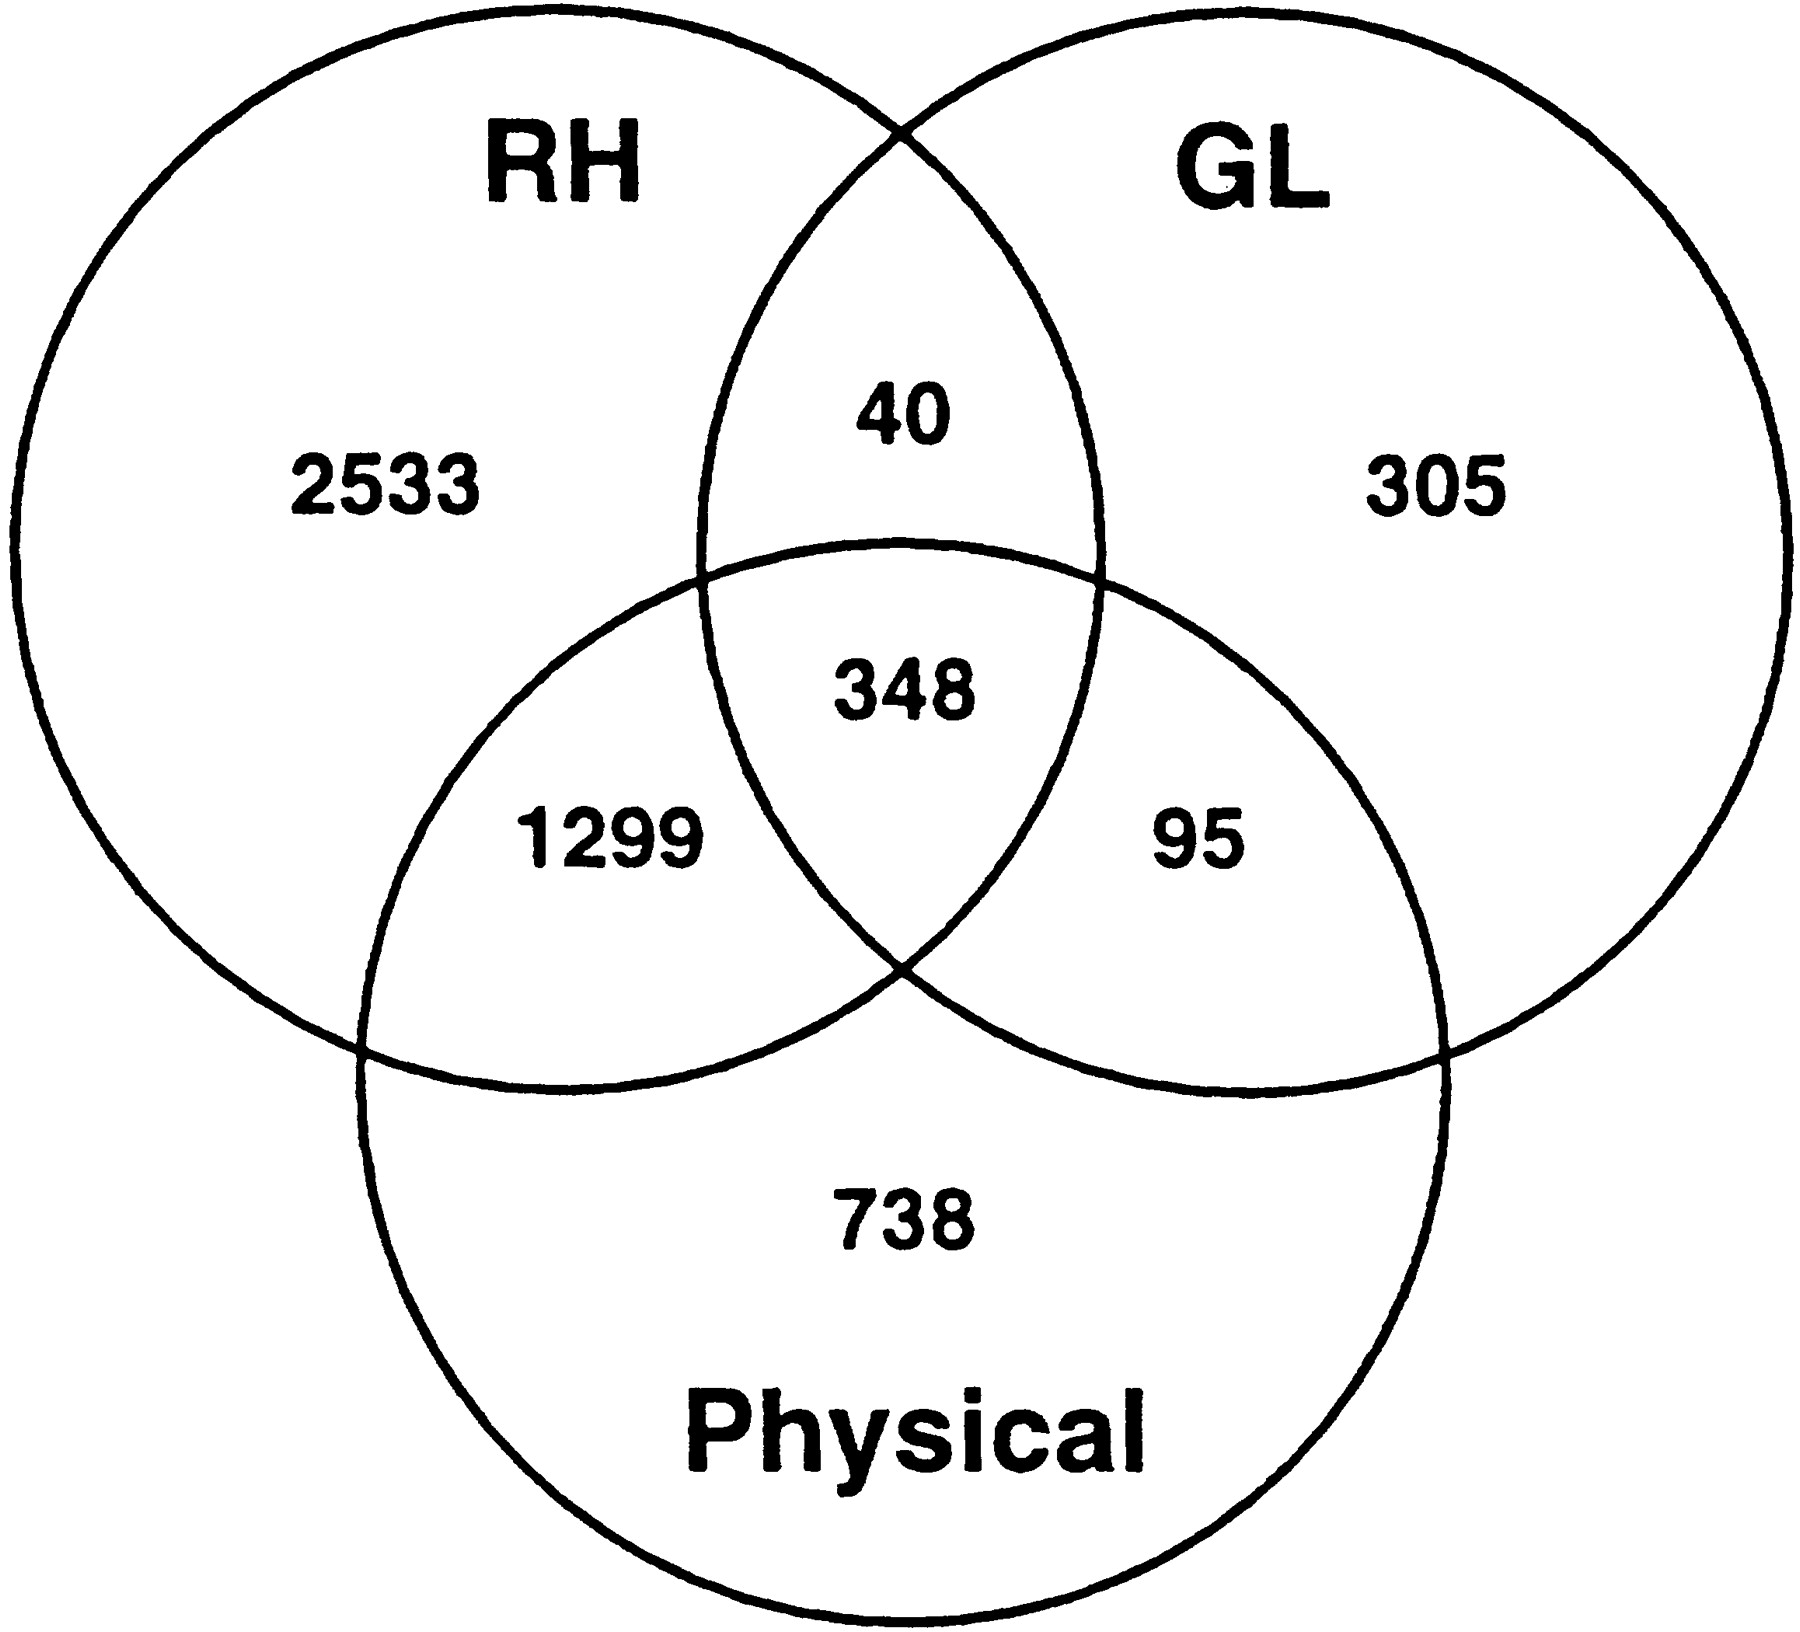
Figure 2.
Venn diagram of marker subtypes. The diagram shows the distribution of markers between and among the RH, GL, and physical tiers. The RH and GL marker sets are defined by all RH and GL markers assigned map positions in CompView (n = 4220 and n = 788), respectively. The physical marker set is defined by the number of unique markers with associated WICGR YACs and/or Sanger PAC/BACs (n = 2480), a subset of which (n = 1742) is localized in CompView.