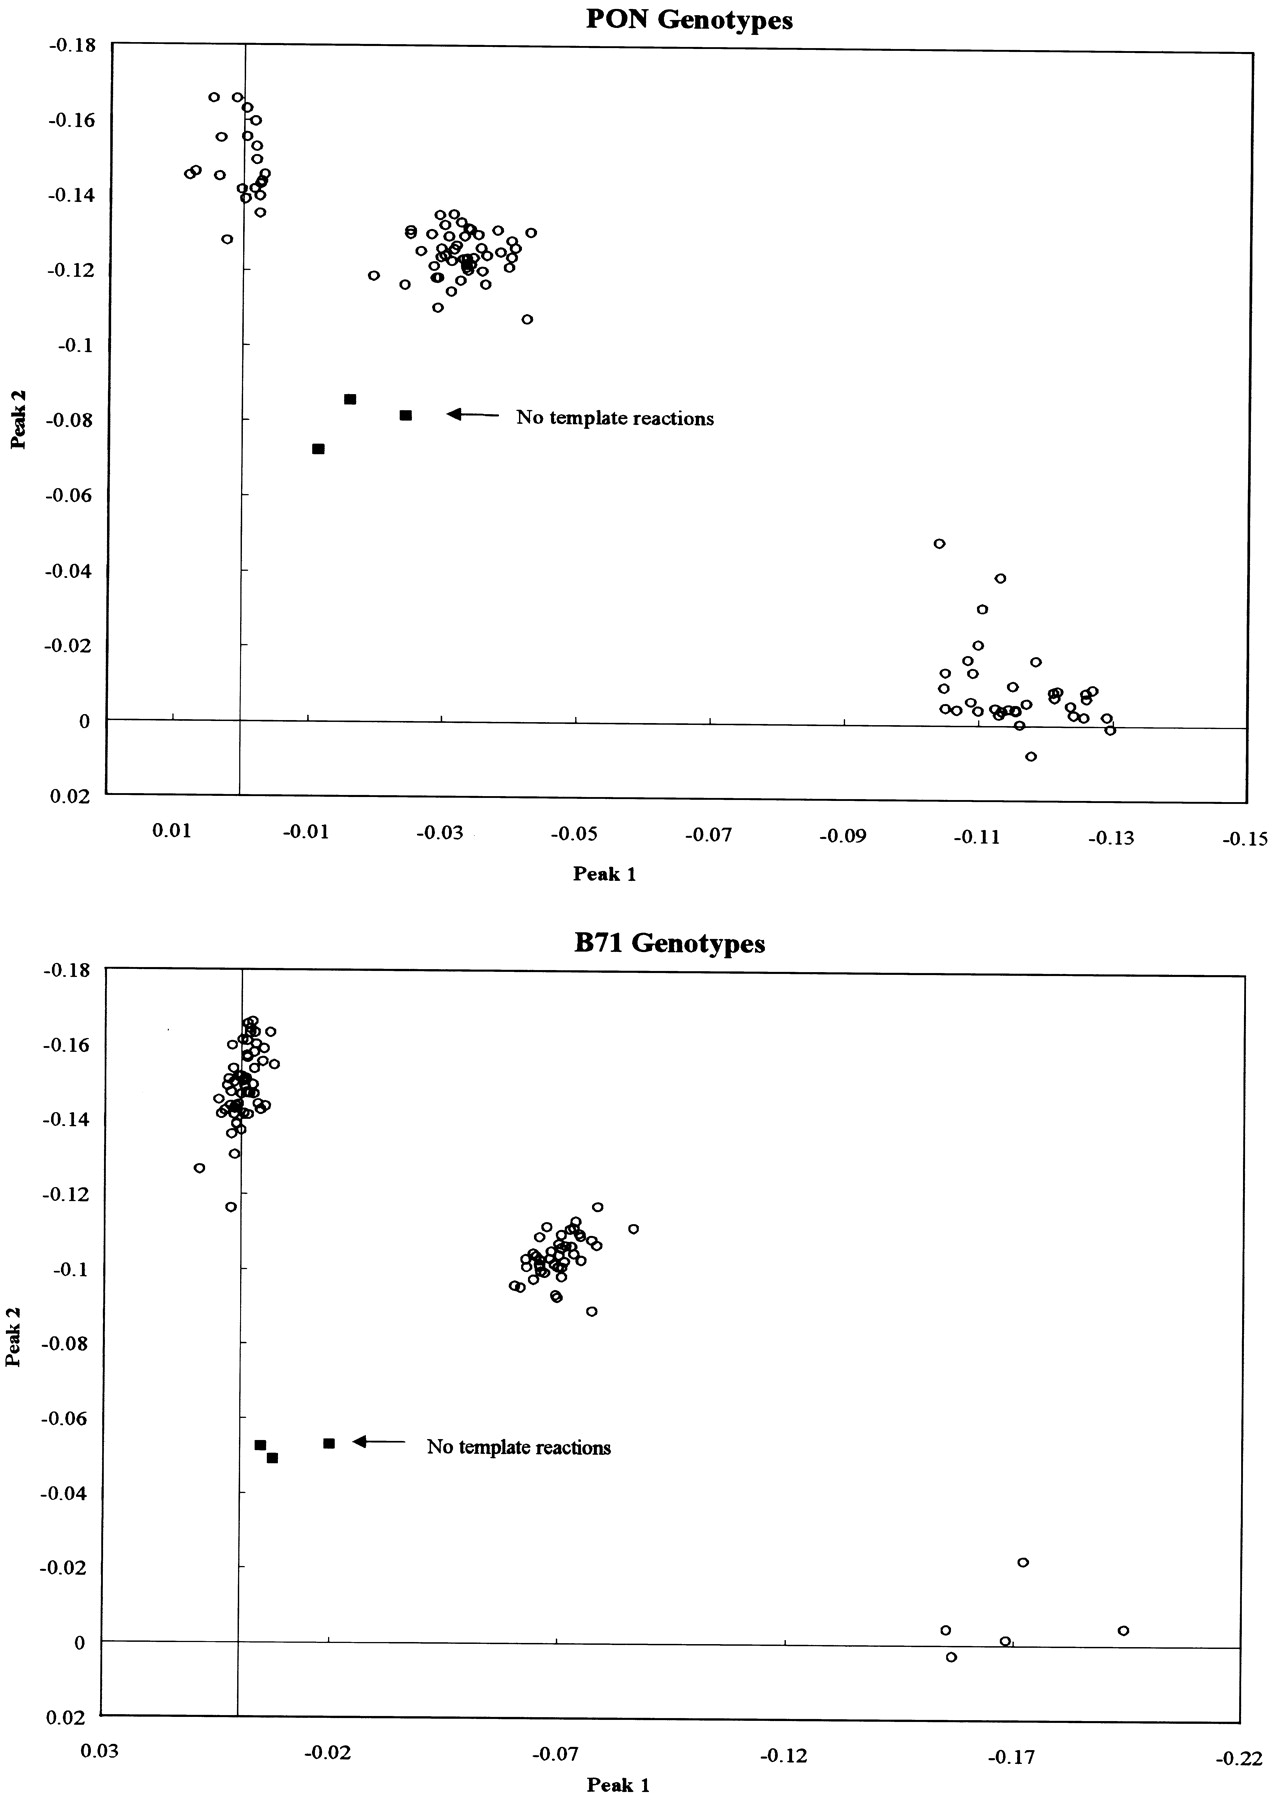
Figure 3.
Cluster analysis. From the melting profile of each sample is plotted its peak 1 and peak 2 areas, as detailed in the text. (○) Genomic DNA containing samples; (◼) no-template controls.
Cluster analysis. From the melting profile of each sample is plotted its peak 1 and peak 2 areas, as detailed in the text. (○) Genomic DNA containing samples; (◼) no-template controls.