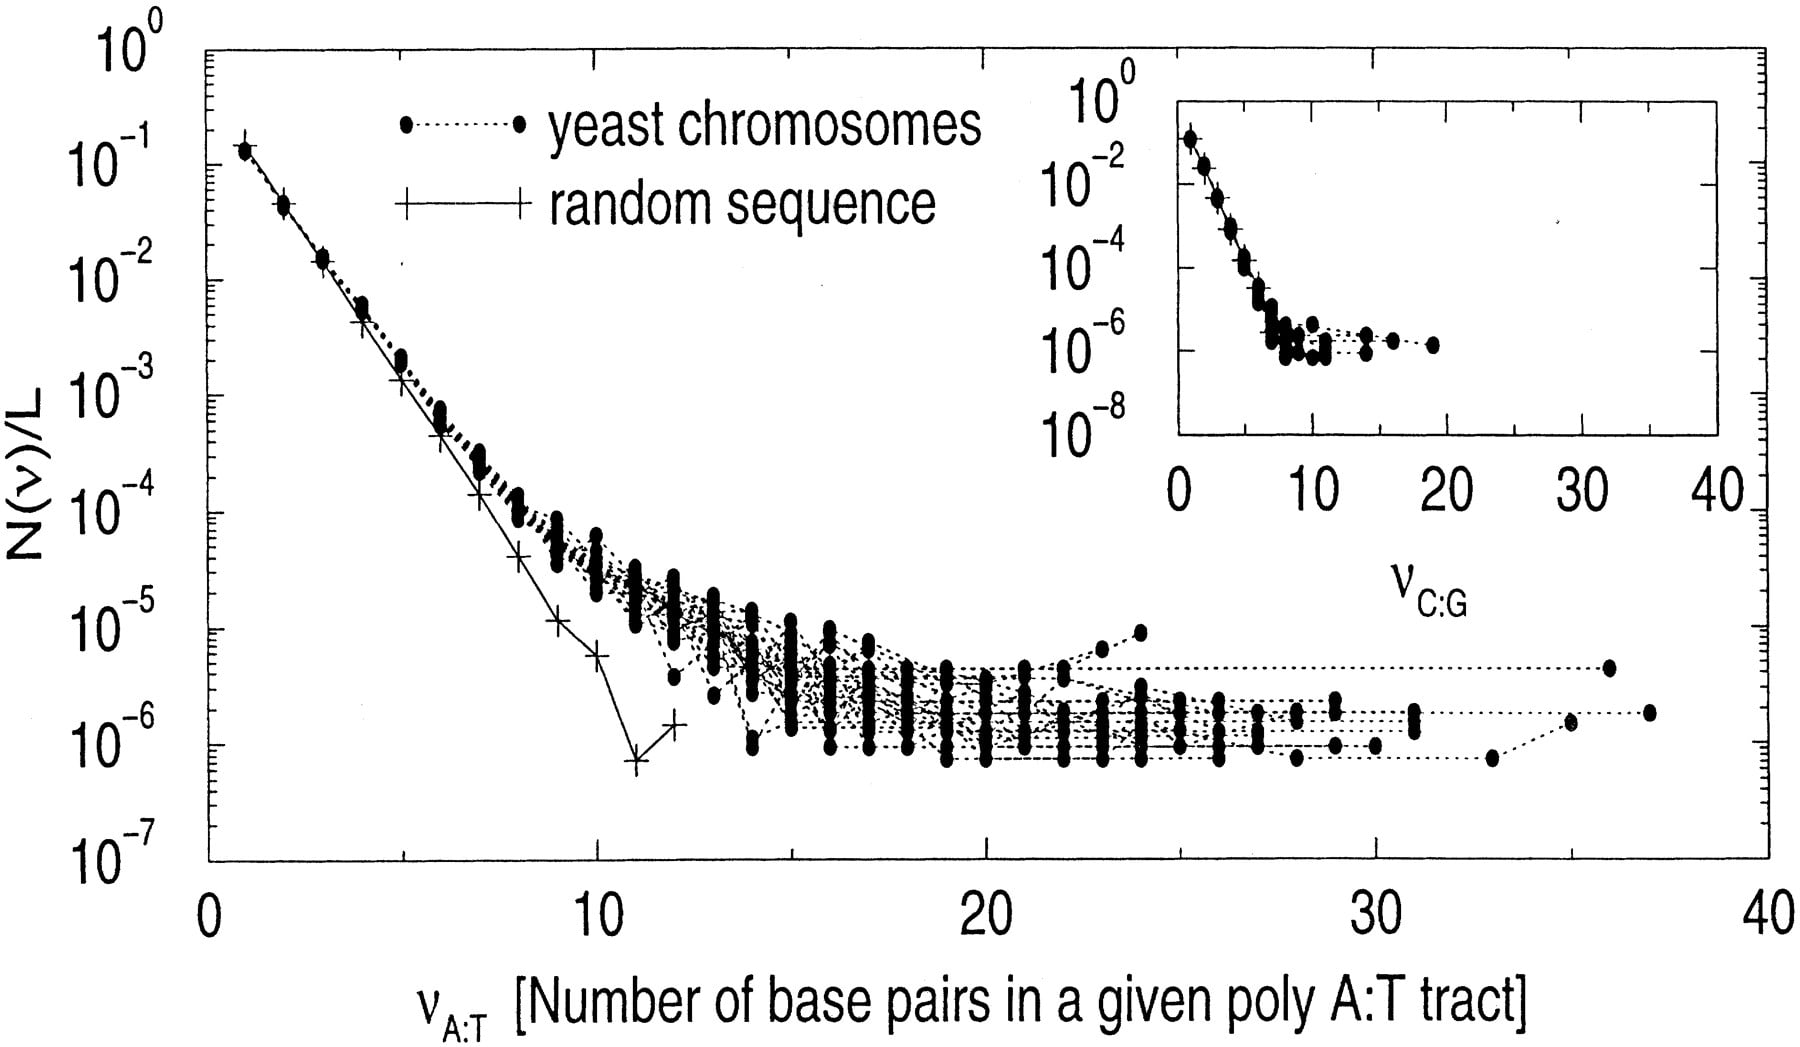
Figure 8.
(Main plot) The histogram (in linear-log scale) of the length of poly(A)/poly(T) tracts in all 16 yeast chromosomes (divided by chromosome length). A similar histogram for corresponding random sequences is also shown for a comparison (it is an exponential function). (Inset) Similar histogram for poly(C)/poly(G) tracts.