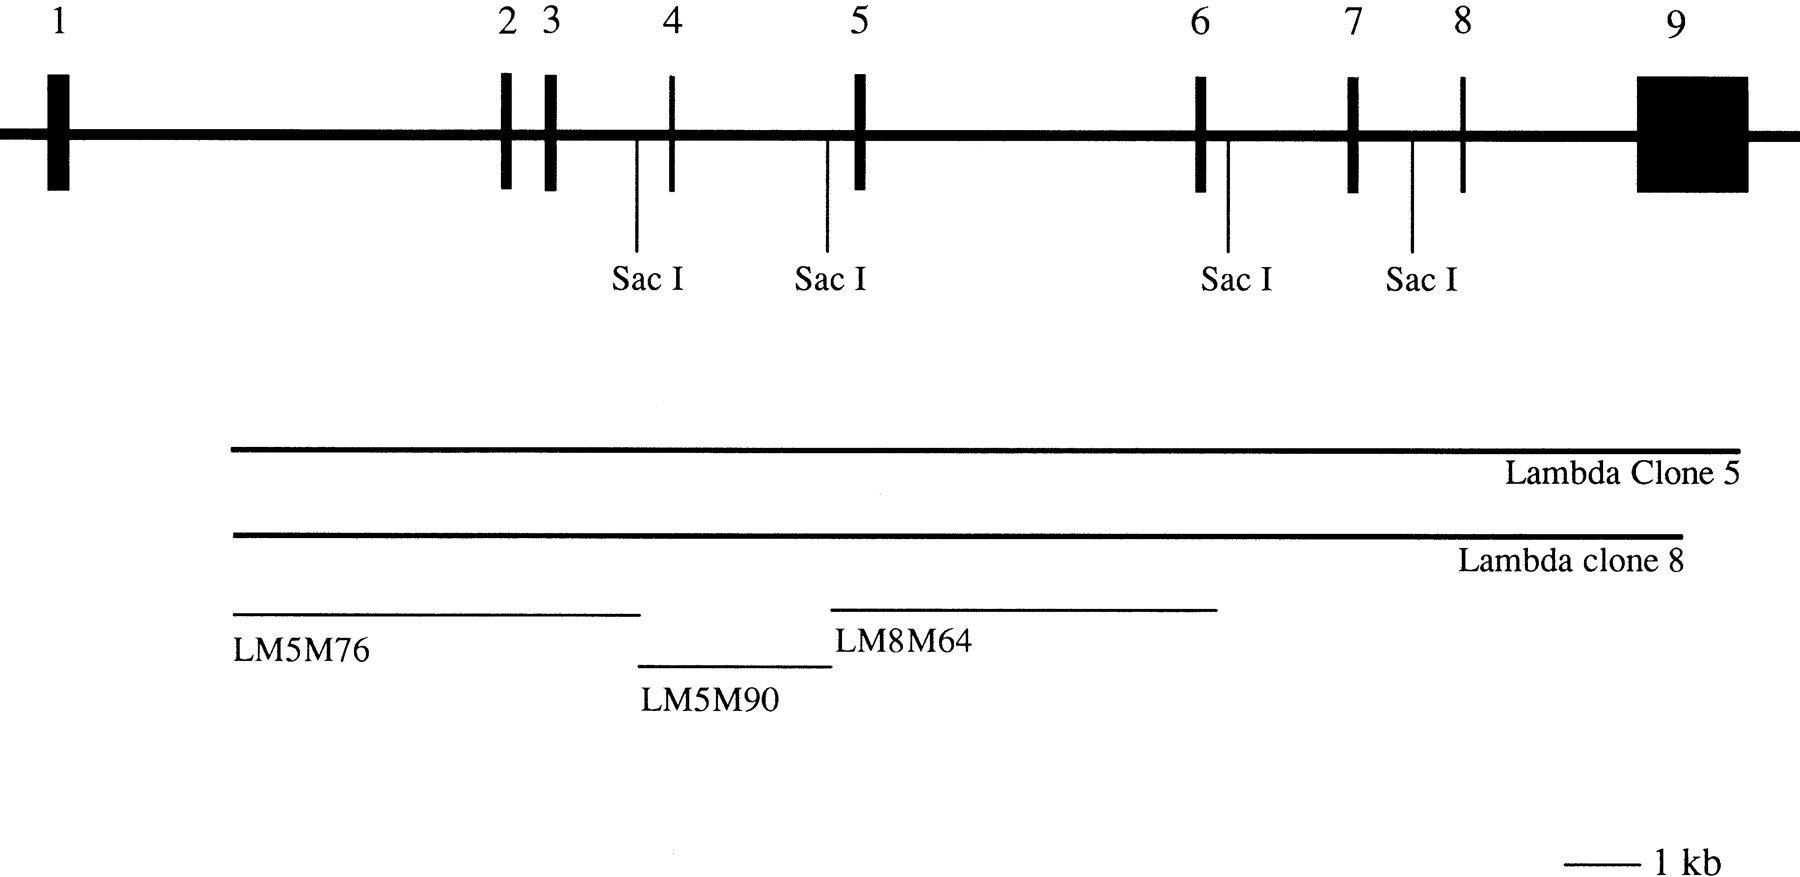
Figure 1.
Structure of the mouse PPT gene. Diagrammatic representation of the mouse PPT gene and the isolated λ clones (λM5 and λM8). Also the subclones LM5M76, LM5M90, and LM8M64 used for FISH are marked. Restriction sites for SacI are indicated on the map.