Figure 5.
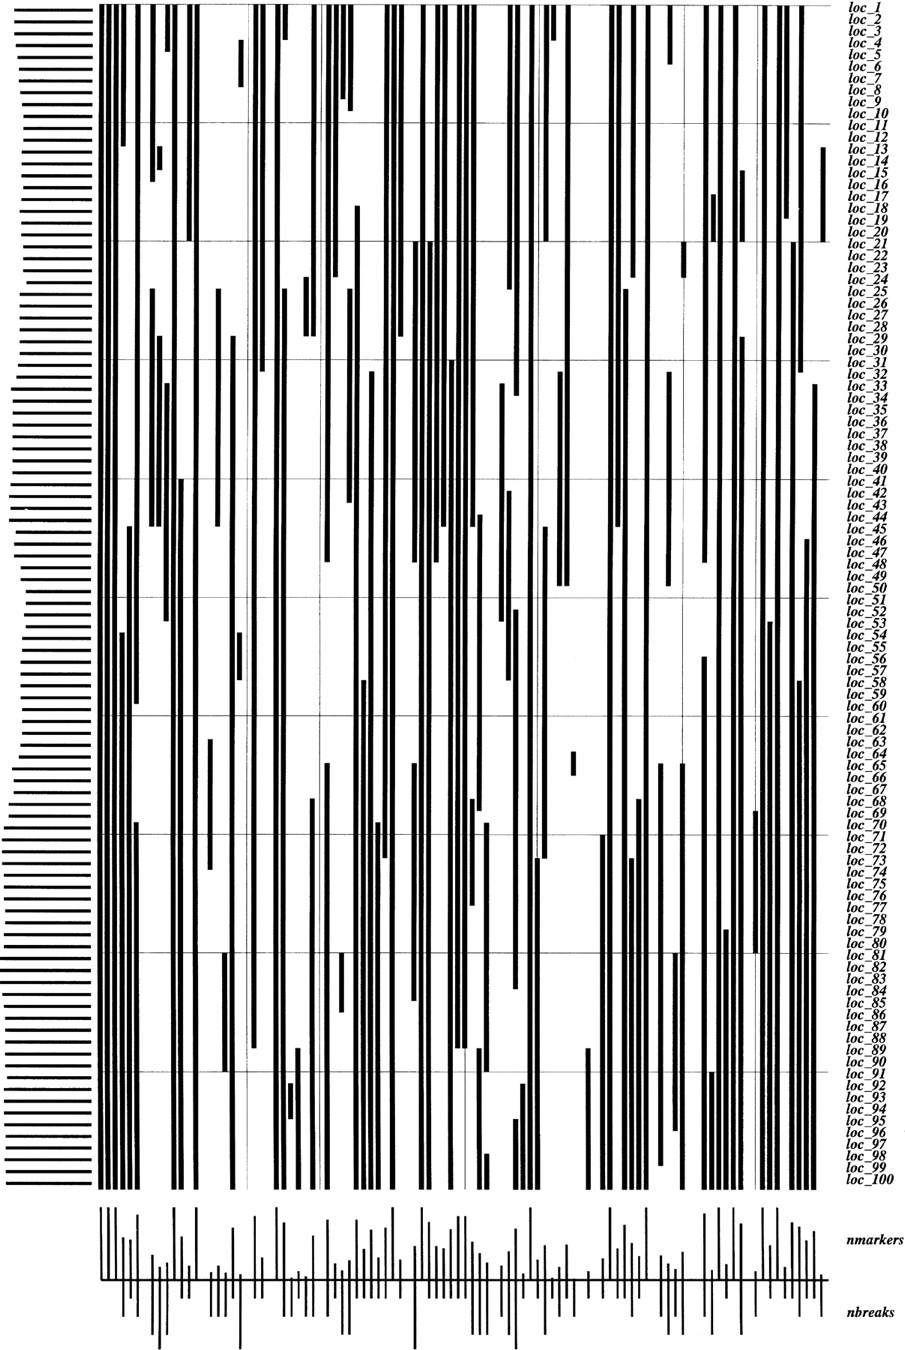
Raw data used for the map in Fig. 4. (Black) Present; (white) absent. The retention frequencies are plotted to the left.(Bottom) Relative numbers of markers and breaks observed in each hybrid cell of the panel.
Raw data used for the map in Fig. 4. (Black) Present; (white) absent. The retention frequencies are plotted to the left.(Bottom) Relative numbers of markers and breaks observed in each hybrid cell of the panel.