Figure 5.
The scatter plot of QDA scores (in log10 scale) for the peaks in (−50, +50) in Fig. 4 vs. the TATA scores (see text for detail).
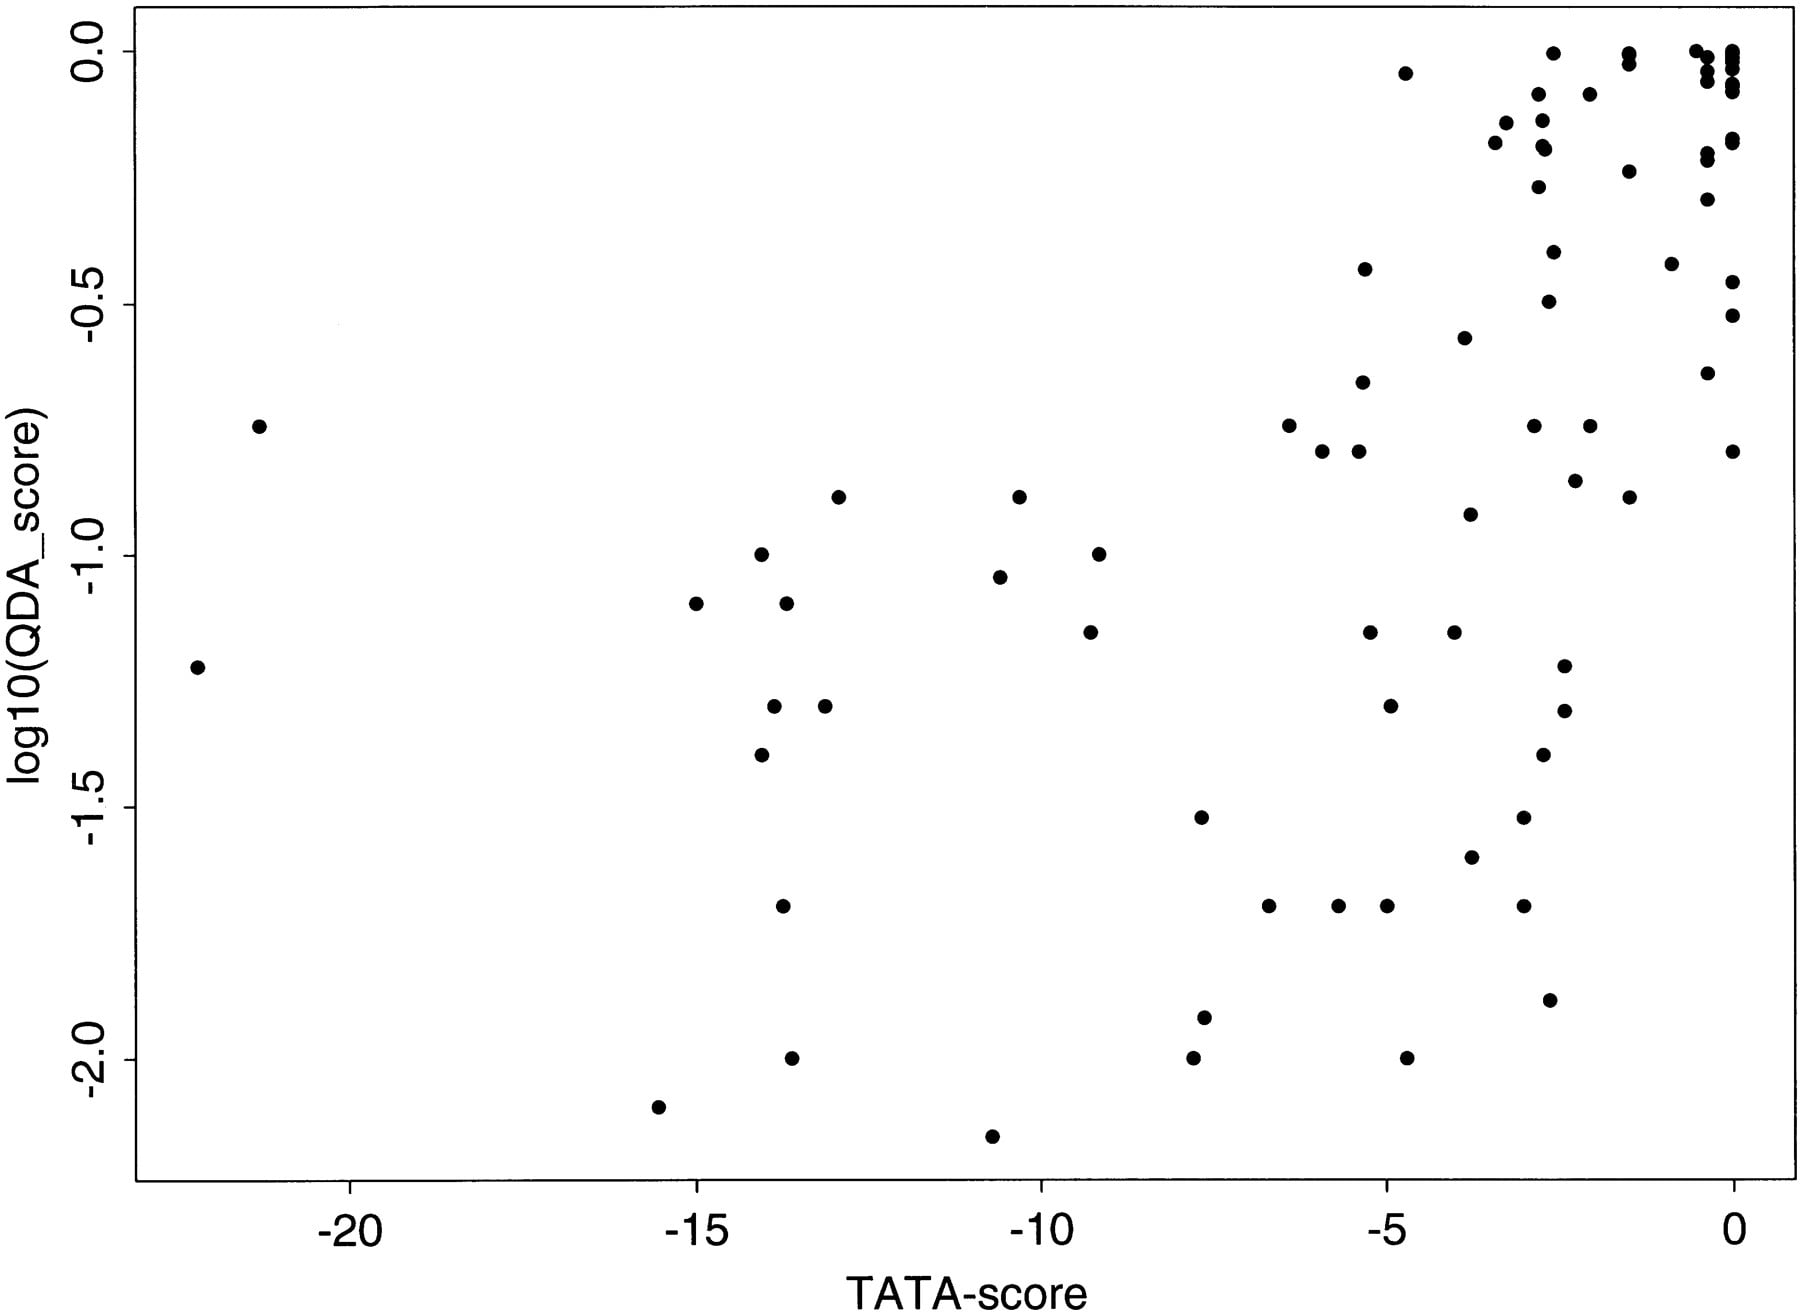
The scatter plot of QDA scores (in log10 scale) for the peaks in (−50, +50) in Fig. 4 vs. the TATA scores (see text for detail).