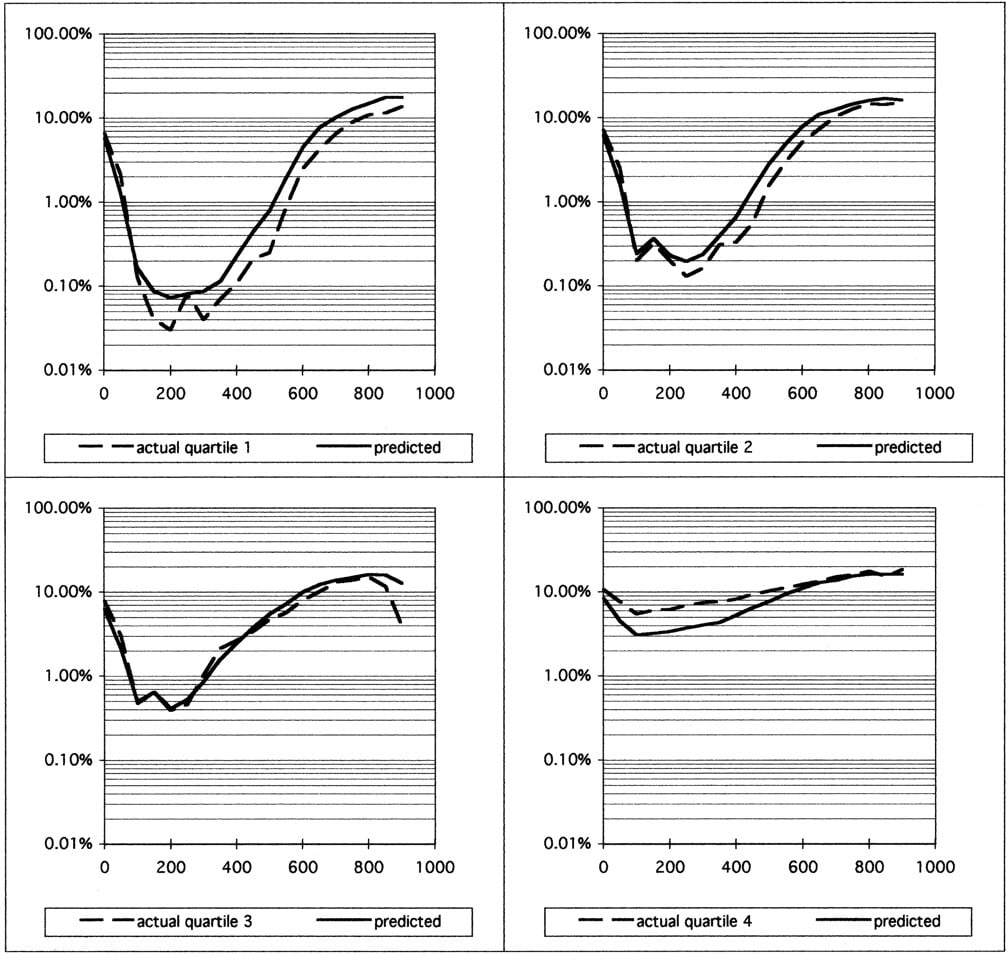
Figure 2.
Actual and predicted error rates in different quality subsets of project B. Sequence reads were sorted by the number of bases with a predicted error rate of at most 0.1% (very high-quality bases), and assigned to quartiles, with quartile 1 corresponding to the highest numbers. Actual and predicted error rates for all sequences in each subset were calculated as in Fig. 1. Note that a number of sequence reads that had been rejected because of too low quality were added back to the data set for illustrative purposes, all of which are in quartile 4. These sequences were not included in the data sets used to generate Figs. 1 and 3 and Tables 1 and 3.