Figure 11.
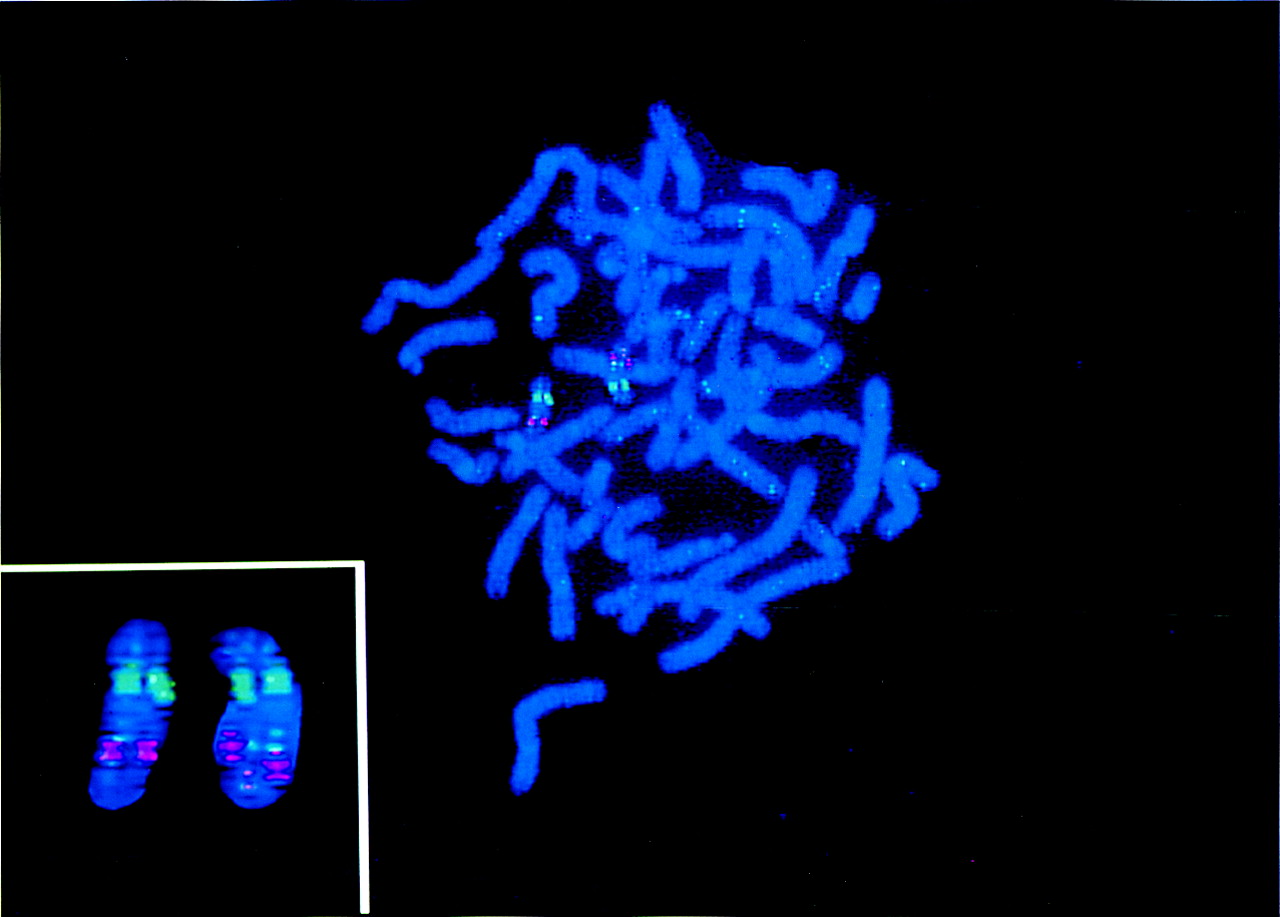
Cytogenetic mapping. BAC DNA is visualized by the light blue signal. The red signal is derived from the 19q13.1-specific probe. (Inset) Both chromosome 19 homologs enlarged.
Cytogenetic mapping. BAC DNA is visualized by the light blue signal. The red signal is derived from the 19q13.1-specific probe. (Inset) Both chromosome 19 homologs enlarged.