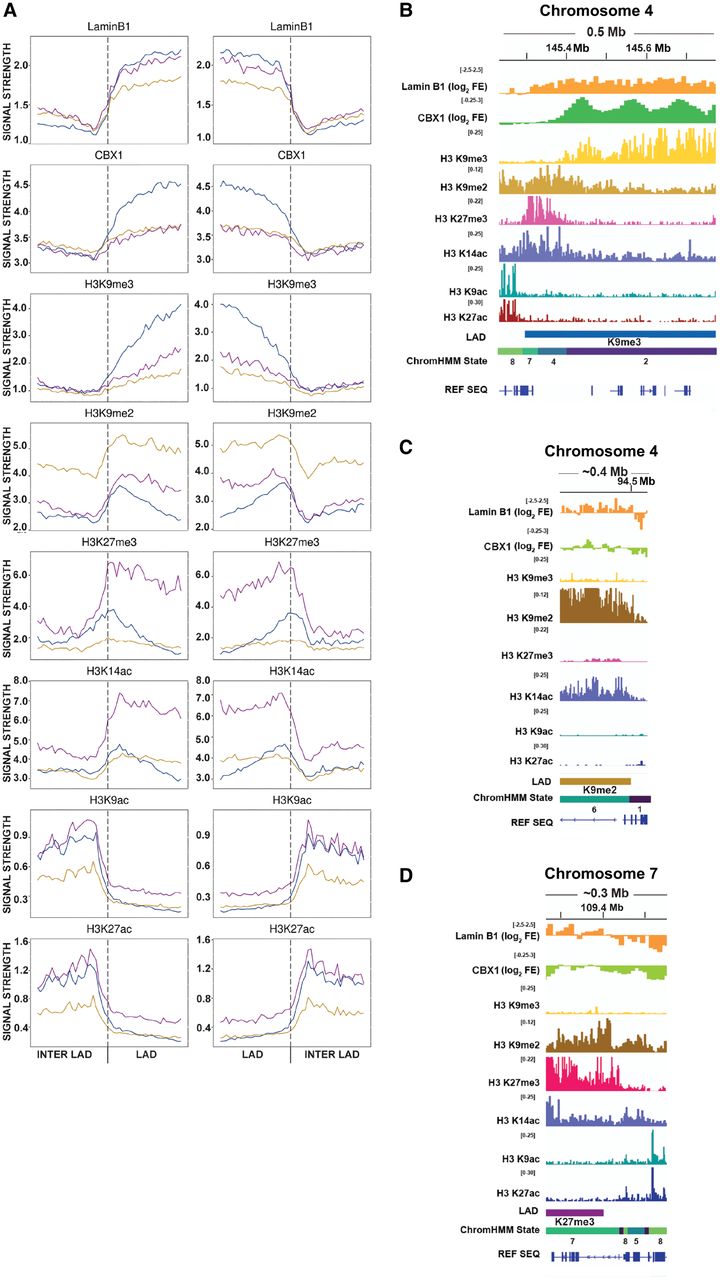
LAD border profiles vary between clusters. (A) Profiles of all features around LAD borders, with each cluster shown separately. Y-axis values represent signal intensity. Boxes show a 500-kb window centered around the LAD borders (vertical dotted line). For LADs that are shorter than the 250-kb range shown, the excess area beyond the opposite LAD border was not included to ensure only LAD chromatin was plotted in the area denoted as the LAD interior. (B) IGV browser example of epigenetic features and ChromHMM state transitions across a Cluster 1 LAD (K9me3 LAD) boundary. (C) IGV browser example of epigenetic features and ChromHMM state transitions across a Cluster 2 LAD (K9me2 LAD) boundary. (D) IGV browser example of epigenetic features and ChromHMM state transitions across a Cluster 3 LAD (K27me3 LAD) boundary.